


Why the Ghanaian cedi broke every rule and what the data says happens next
March 23, 2026 by diadem445c3650ff
There is a moment in currency analysis that every trader dreads, when the market does the opposite of what textbook economics says it should. In September 2025, the Bank of Ghana cut its benchmark interest rate by 350 basis points. Every financial model in the room said the cedi should have weakened. Instead, it strengthened by roughly 14 percent over the following four weeks. No crash, no panic, just a cedi that simply refused to follow the script.
That anomaly is where this story begins.
The rate cut that defied everything
Standard monetary theory is clear on this point. When a central bank cuts interest rates, the yield on domestic assets falls, making them less attractive to international investors. Capital flows out. The currency depreciates. It is one of the most reliable relationships in all of economics.
Ghana broke it. To understand why, you need to look beyond the rate decision itself and understand the context it sat inside. By September 2025, Ghana had navigated one of the most dramatic economic recoveries any African economy has managed in recent memory. Inflation had been running at 23 percent. The cedi had traded as weak as 16.40 to the dollar at its November 2024 low. The IMF program was in place, debt restructuring was proceeding, and the numbers were moving in the right direction for the first time in years.
When the Bank of Ghana cut rates by 350 basis points, the market did not hear that yields were falling. It heard something much more important: Ghana has fixed its economy. The re-rating of sovereign credibility overwhelmed the mechanics of any yield calculation. The international capital did not flee, it returned. The cedi did not weaken, it surged.
We ran a formal event study across all four rate cuts in the cycle and the result is unambiguous.

“The market did not hear that yields were falling. It heard that Ghana had fixed its economy.”
Four cuts, four completely different markets
The BoG did not stop in September. Between then and March 2026, the Monetary Policy Committee cut rates three more times, eventually bringing the policy rate from 25 percent all the way down to 14 percent; a total reduction of 1,100 basis points in six months.

Each successive cut told a progressively different story. Cut 2 in November 2025, another 350 basis point move, produced the textbook response. The cedi weakened approximately 3.8 percent over four weeks. Standard. Expected. The credibility premium from Cut 1 had already been priced in. Cuts 3 and 4 told the most revealing story of all; the depreciation per basis point fell dramatically with each successive cut.

What you are seeing in those numbers is textbook diminishing returns, the market has been so thoroughly priced in the easing cycle that each additional cut generates progressively less reaction. By the time Cut 4 arrived on March 18, the cedi had already moved before the MPC even announced. The pre-positioning window compressed from three weeks before Cut 1 to a single week before Cut 4.
Is the cedi actually cheap right now?
The question every treasury desk and corporate client is asking right now is whether 10.92 cedis to the dollar represents an attractive rate to convert or whether further weakness is coming. The answer requires a fundamental anchor, and the one that matters most is the Purchasing Power Parity model.
PPP is simple in concept: over time, exchange rates should reflect the difference in inflation rates between two countries. Ghana’s inflation has collapsed from 23 percent to 3.3 percent while the United States runs at approximately 2 percent. The calculation places the current PPP fair value of USD/GHS at approximately 11.25.
The dollar today is mildly overvalued by roughly 3 percent relative to PPP fair value. This is a critical finding because it reframes the depreciation narrative entirely. The cedi is not in crisis, it is correcting toward economic reality after a period of overvaluation in late 2025.
This same framework explains the Databank research house year-end 2026 forecast of 12.85. At that rate, accounting for the cumulative inflation differential between Ghana and the US across a full year, the dollar would reach its long-run PPP equilibrium. It is not a collapse forecast. It is a mean-reversion forecast.
The three structural anchors protecting the cedi
Despite the ongoing easing cycle, three structural factors prevent the cedi from experiencing the kind of disorderly depreciation that characterised 2022 to 2024.

The reserves position alone is formidable. At 5.8 months of import cover, nearly double the IMF minimum of 3 months, the Bank of Ghana has the ammunition to defend the currency if it chooses to. Even a stress test assuming a 20 percent oil price shock reduces cover only to 5.1 months. Still well above critical levels.
The carry trade is equally important. At 14 percent BoG rate versus 4.5 percent in the United States, Ghana offers roughly 950 basis points of carry spread. With cedi depreciation running at approximately 5 to 6 percent annually, net carry remains positive at 3.5 to 4.5 percent. That positive carry creates a natural floor.
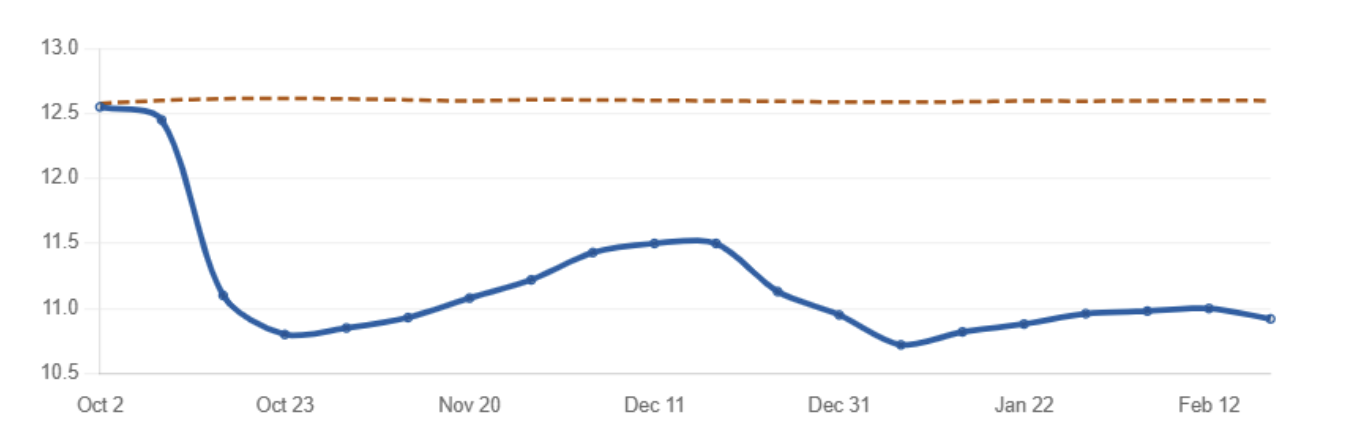
Gold rounds out the structural picture. Ghana is Africa’s largest gold producer, and the Gold Board generates approximately 750 million dollars of monthly FX inflows. A regression of gold prices against USD/GHS produces a Pearson correlation of negative 0.576; when gold rallies, the cedi typically strengthens. With gold above 1,950 dollars and geopolitical tensions keeping it elevated, this structural inflow provides meaningful cedi support even as rates fall.

Fig. 6 — Gold price regression model. When actual USD/GHS diverges above the gold-implied value by more than 0.3, it signals the dollar is overvalued relative to Ghana’s export fundamentals.
What every treasurer needs to know before May
The next Bank of Ghana MPC meeting is scheduled for May 18 to 20. Based on the lead-lag pattern documented across all four cuts, the market will begin positioning approximately one week in advance around May 11. Any treasurer or corporate FX manager with dollar requirements in May needs to be aware that the optimal conversion window is before the market front-runs the cut, not after.
The composite Cedi Sentiment Score, a proprietary index combining six independent technical indicators into a single 0-to-100 signal, currently reads 76. Above 70 is the confirmed bearish threshold for the cedi.
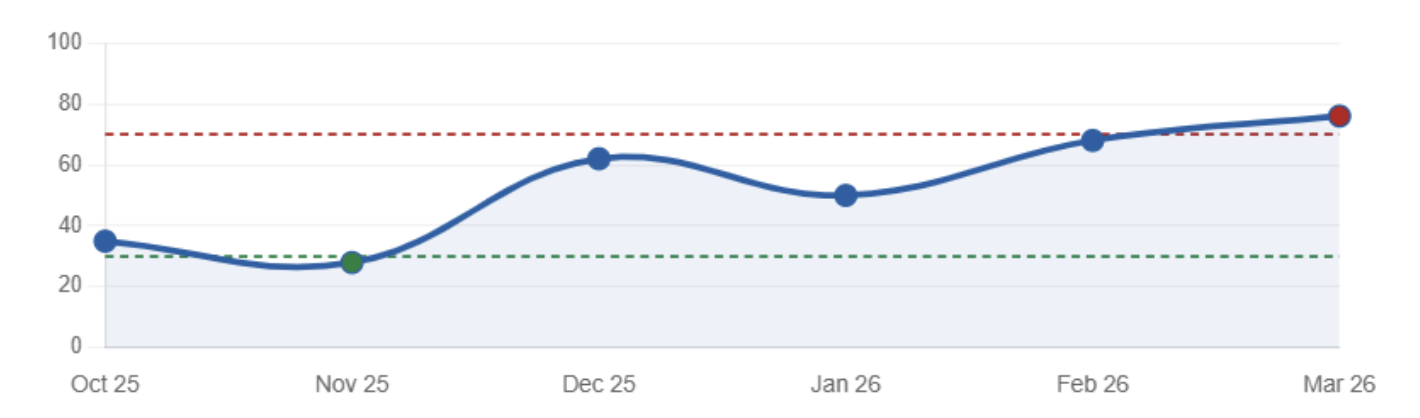
Fig. 7 — Cedi Sentiment Score progression. The score of 76 in March 2026 is the highest in the series, representing unanimous alignment across all six indicator components.
The score has never been higher across the six months of this analysis. Every component — trend strength, momentum, positioning, volatility regime; is aligned in the same direction. The direction is clear. The pace will be measured. The carry still provides a floor. But 10.92 today will, in all probability, look like an attractive rate by December.