




Meet the Dollar on TikTok: How Gen Z in Africa Built Their Own Reserve Currency
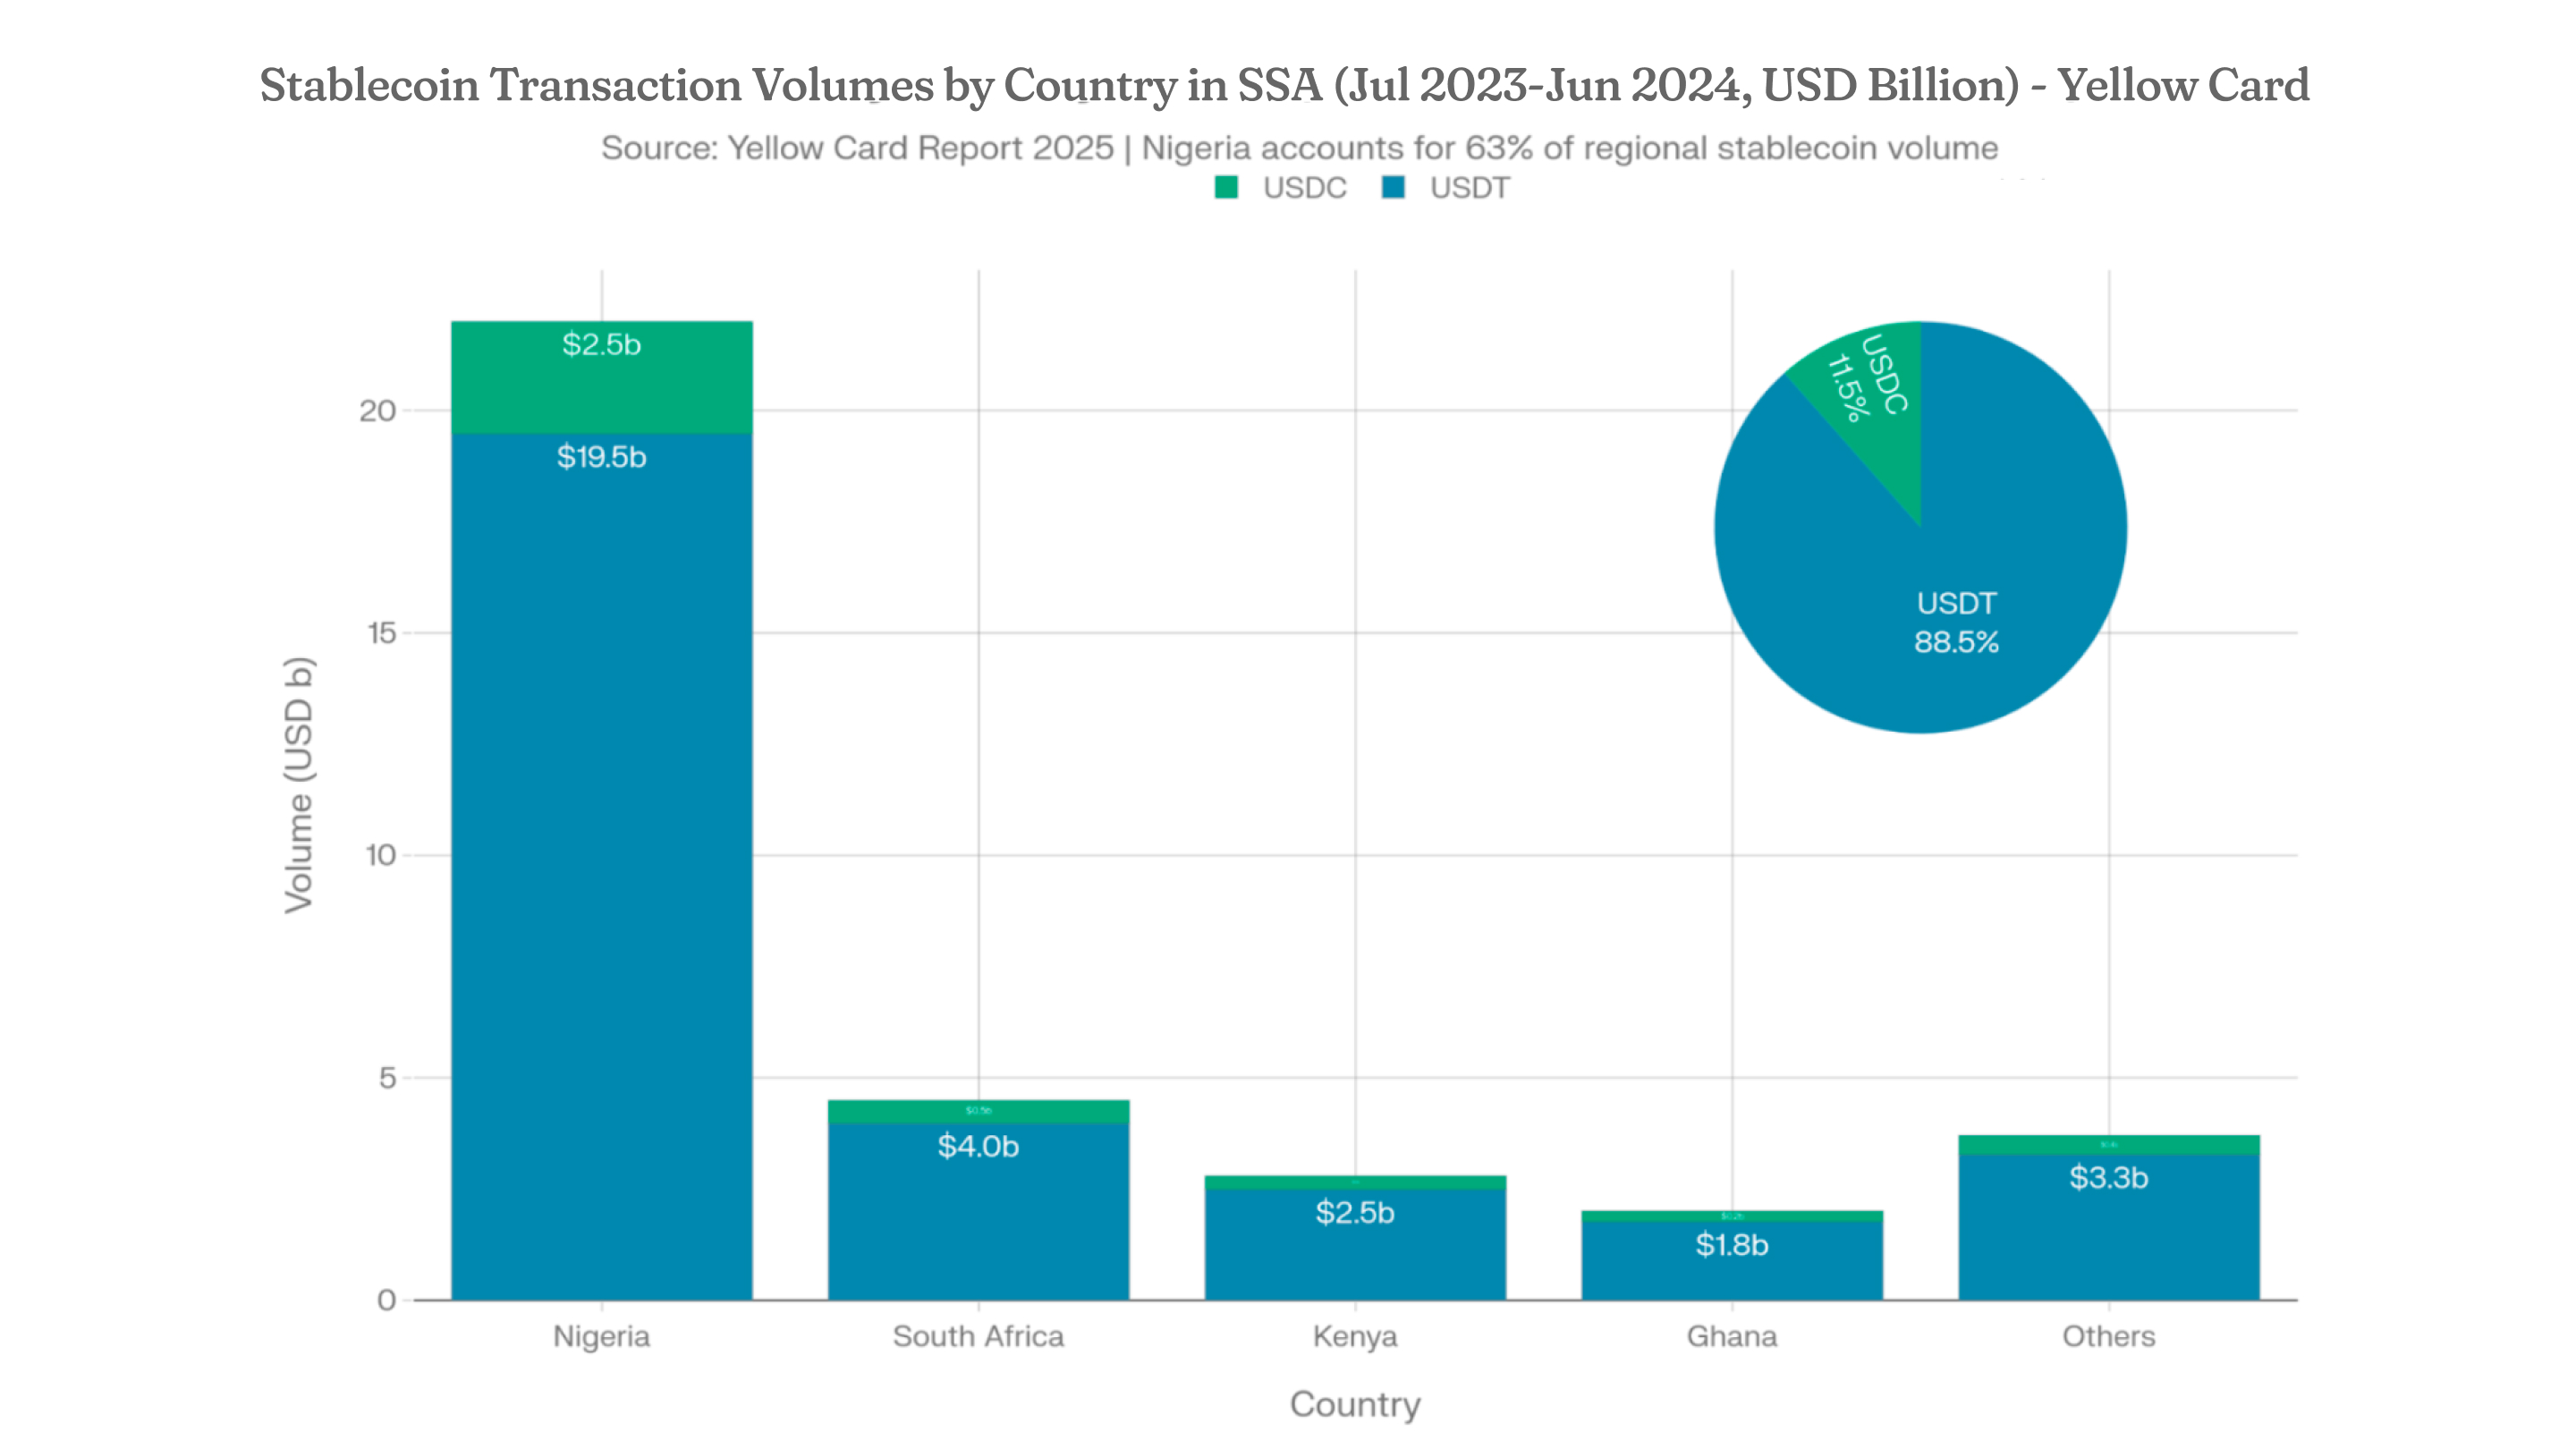
February 25, 2026 by johneb492254456 In bustling online spaces from Lagos to Nairobi, young Africans are quietly rewriting the rules of money by turning to dollar-pegged digital assets that they access and learn about directly on their phones. This movement has grown from necessity in economies marked by volatility, where traditional banking often falls short, into a vibrant, community-led system that gives everyday users control over stable value storage and borderless transfers. What makes it stand out is how knowledge spreads not through formal institutions but via quick videos, group chats, and peer recommendations that turn smartphones into personal finance hubs, allowing a generation to build resilience one tap at a time. Sub-Saharan economies continue to navigate persistent challenges around local currency stability, as documented by the International Monetary Fund, where depreciations against the US dollar transmit sizable inflationary effects that can linger for up to two years. In Nigeria the naira has faced repeated pressures leading to sharp value losses, while the Angolan kwanza dropped more than 60 percent in value since mid-2023 amid broader supply and external shocks tracked by IMF staff reports. The World Bank has similarly highlighted divergent inflation paths across the region, with many countries seeing elevated food and import costs tied to exchange-rate movements that erode savings and complicate cross-border trade for ordinary households. These realities have left young people searching for tools that can shield their earnings and remittances from such swings without relying on scarce physical dollars or expensive bank channels. Stablecoins pegged to the US dollar have stepped in as reliable stores of value and transfer mechanisms, offering near-instant settlement at minimal cost compared with legacy systems. According to Yellow Card’s analysis of emerging-market activity, these assets represented 43 percent of total cryptocurrency transaction volume across Sub-Saharan Africa in 2024, with Nigeria alone accounting for nearly 22 billion dollars in stablecoin flows between July 2023 and June 2024 and USDT handling the vast majority at roughly 88.5 percent within that platform’s volume. Users turn to them for hedging daily expenses, paying international suppliers, and receiving family remittances because the peg provides predictability in environments where local currencies fluctuate sharply, effectively letting individuals hold and move dollars digitally without needing a traditional foreign-currency bank account. Short videos and group conversations have transformed how financial know-how travels, with platforms such as TikTok hosting quick tutorials on wallet creation and trading, while Telegram communities dedicated to crypto have expanded by 189 percent since early 2023 to reach over three million users continent-wide. WhatsApp groups serve as daily support networks where peers exchange tips on converting local money into stable assets or navigating peer-to-peer marketplaces, filling the gap left by limited formal education on digital tools. This organic ecosystem appeals strongly to tech-native young adults who share real-time successes and warnings, turning what once required bank visits or costly advisors into accessible, trust-based learning that fits into busy lives. Chainalysis data for the period July 2024 to June 2025 places Sub-Saharan Africa as the third-fastest-growing cryptocurrency region globally, with more than 205 billion dollars in on-chain value received a 52 percent rise year-over-year much of it coming through small retail transfers under 10,000 dollars that reflect everyday use by tech-savvy younger users. Nigeria stood out with 92.1 billion dollars in on-chain receipts during that window, while a broad YouGov survey across 15 countries in early 2026 found nearly 80 percent of respondents in both Nigeria and South Africa already holding stablecoins, with more than 75 percent intending to add more in the year ahead. In Nigeria the preference was especially pronounced, as 95 percent of surveyed individuals said they would rather receive payments in stablecoins than in the naira, underscoring how these tools have become embedded in daily financial routines for a generation seeking control and predictability. By choosing stablecoins, users cut remittance expenses dramatically in a region where sending 100 dollars can traditionally cost up to 30 dollars to neighboring countries, as highlighted in discussions around the YouGov findings. Chainalysis notes that Africa’s activity ranks notably high when scaled against GDP, placing the region second globally in certain relative measures and ahead of many peers in grassroots momentum. This bottom-up pattern shows how digitally connected populations can self-organize around value-preserving tools faster than institutions adapt, offering a model of inclusion for other volatile emerging markets while also prompting central banks worldwide to consider how widespread dollar-pegged digital holdings might influence local monetary policy and capital flows. Looking forward, clearer regulatory steps such as Nigeria’s 2025 frameworks classifying stablecoins and the launch of initiatives like the continent’s first regulated stablecoin projects, could help integrate these tools more safely into broader economies while preserving innovation. For Gen Z across Africa this represents genuine agency, turning economic headwinds into a platform for global participation and personal financial security through community-driven learning. At the same time, ongoing dialogue between users, platforms, and policymakers will be essential to harness the benefits of faster, cheaper finance while addressing concerns around local currency usage and long-term stability, ensuring the digital dollar on TikTok strengthens rather than sidelines national systems.
johneb492254456



How Greenland Is Becoming a New Flashpoint for Global Resource Competition
February 19, 2026 by johneb492254456 Greenland’s vast Arctic frontier is rapidly moving from a remote backwater to the center of global geopolitical and resource competition. Warming is opening shipping lanes and revealing under-ice deposits, making Greenland “a strategic Arctic linchpin”. Its position atop the North Atlantic anchors the Greenland–Iceland–U.K. (GIUK) gap, a Cold War chokepoint that remains vital for tracking Russian naval movements. The U.S. maintains a large military presence there – notably the Pituffik (Thule) Space Base for missile-warning and space surveillance – under a 1951 defense agreement with Denmark. At the same time Greenland sits astride emerging Arctic routes (the Northwest Passage and a Transpolar corridor) that, as sea ice thins, could one day slash Asia-Europe voyage times]. In short, climate change and geography are giving Greenland outsized military and logistic importance in the US/EU–Russia–China balance of power. Greenland is estimated to hold enormous quantities of critical minerals. Its rare earth element (REE) reserves – used in magnets, batteries and advanced electronics – may exceed 30 million tonnes in total (with about 1.5 million tonnes currently “proven” as economically viable). This ranks Greenland among the world’s top REE holders (roughly 8th globally) and possibly second only to China once more exploration is done. Major known deposits include the Kvanefjeld and Tanbreez projects in southern Greenland. (Kvanefjeld’s ore contains both rare earths and uranium; Tanbreez is rich in heavy rare earths plus zirconium/niobium.) In addition, Greenland has significant known occurrences of graphite (for batteries), copper, gold and other “modern” minerals. Overall, one recent survey found 25 of the EU’s 34 critical raw materials inside Greenland]. Greenland’s offshore oil and gas potential is also large on paper. A USGS assessment in 2007 estimated “significant oil and gas reserves” on the Greenland shelf. Subsequent seismic surveys hinted at hydrocarbon prospects under the seabed. However, Greenland’s government (citing environmental and economic concerns) halted new petroleum licensing in 2021. Thus despite reports of “vast reserves of oil… offshore”, drilling is currently off-limits. Exploiting any oil would require building pipelines and ports in extreme conditions – a multi-billion dollar gamble many consider unprofitable at today’s prices]. United States: Washington views Greenland through both strategic and economic lenses. Militarily, U.S. strategy is focused on denying adversaries sanctuary: Trump’s push for “ownership” was justified as essential to defend the GIUK gap. Analysts say Greenland gives the U.S. “disproportionate leverage” by hosting early-warning radar and anchoring an anti-sub chokepoint. On resources, the U.S. has quietly ramped up engagement: for example, in 2023 the Danish and Greenland foreign ministers met U.S. officials amid talk of sharing critical minerals. The Biden administration has extended financing and trade agreements to help Greenland develop mining in ways that secure supplies of rare earths outside China. In 2024 U.S. diplomats even reportedly lobbied Denmark to steer Greenland’s richest rare-earth concession (Tanbreez) toward Western companies. All these moves reflect a U.S. desire to pre-empt China and Russia: “Gaining access to Greenland’s mineral resources would be in line with the Trump administration’s drive to secure critical minerals as a national security imperative”. China: Beijing calls itself a “near-Arctic state” and has long eyed Greenland’s minerals and routes, though its foothold is now limited. Chinese state firms won a 6.5% stake in the Kvanefjeld rare-earth project, and Chinese investment once accounted for over 10% of Greenland’s GDP. China’s stated Arctic policy (the “Polar Silk Road”) highlights shipping and scientific interests. In practice, however, most Chinese Arctic engagement is with Russia’s Northern Sea Route; cooperation with Moscow on icebreakers and LNG shipping has taken priority. In Greenland itself, security concerns have limited China’s gains: past bids by Chinese firms to buy airfields or naval bases were blocked by Denmark under U.S. pressure. Today Chinese miners are essentially on the sidelines. A recent analysis notes that “since Donald Trump’s first presidential term… Chinese companies in Greenland have faced pushback,” and Beijing has discouraged new ventures there. Chinese officials officially oppose U.S. “threats” in Greenland, but Chinese firms do hold interests (for example, Shenghe Resources in Tanbreez) which Western partners have worked to contain. Russia: For Moscow, Greenland is a strategic concern more than an immediate resource target. Russia’s Arctic strategy emphasizes its own hydrocarbon-rich shelf and the Northern Sea Route (NSR). Russia has invested heavily to keep the NSR open year-round – cargo through the route jumped from 33 million tons in 2021 to nearly 39 million in 2024 – and fields like Yamal and Gydan will anchor a vast “new oil and gas province” to serve Asian markets. In that context, Greenland faces Russia across the Arctic; control of Greenland would constrain the Russian Northern Fleet’s access to the Atlantic. Hence U.S. officials frame Greenland as a counter to Russian power projection. Russia, meanwhile, portrays the U.S. debate as Washington in disarray – Beijing observers quip that a U.S. annexation of Greenland would mean “NATO’s demise” and benefit China. (Notably, Russia is now deepening ties with allies like India under a new logistics pact for Arctic ports, underlining how the Arctic is a broader contest.) European Union (and Allies): European countries see Greenland’s minerals as a way to diversify away from China. The EU’s 2023 Critical Raw Materials Act specifically identifies Greenland in its global supply chain plans. The UK has launched trade talks in 2025 to secure rare-earths, as have France and other NATO partners. At a 2025 summit, Greenland’s prime minister described the EU as a “stable, reliable and important partner” and urged it to invest in Greenland’s mines. Brussels has already signed an EU–Greenland raw-materials partnership (2023) and is working with Denmark on Arctic development. EU strategists caution that any European efforts must include strict environmental and social safeguards – Greenpeace notes that “opportunities for mining and trans-Arctic shipping will not be commercially viable in the near term” – and stress close coordination so as not to undercut each other (e.g. UK vs EU competitive deals). In short, EU capitals see Greenland as a Western-friendly resource base to counter Chinese dominance, but also recognize Greenland’s autonomy and want to respect its climate policies. Greenland’s leaders face a classic dilemma. On one hand, mining and (potentially) oil development promise revenue, jobs and steps toward economic independence from Danish subsidies. Greenland Minerals Ltd. estimates that the Kvanefjeld rare-earth mine would eventually produce over $600 million in annual revenue (nearly four times Greenland’s current GDP). With imports and aid from Denmark equaling half the economy, Greenlanders eyeing full sovereignty see resource exports as an alternative. On the other hand, development threatens Greenland’s fragile environment and traditional livelihoods. Mining requires massive infrastructure – roads, ports, power – in a land with almost no existing transport networks. Extracting one metal often involves byproducts of another (e.g. uranium in the Kvanefjeld ore). Local people recall that past Arctic mining in places like Narsaq left heavy-metal pollution decades later. Greenland’s Inuit population insists on control over any project. The 2009 Self-Government Act enshrines the right of Greenlanders to self-determination – meaning no foreign “sale” of Greenland can occur without local consent. In practice, this has given Greenland’s parliament veto power over projects. In 2021 the new Inuit Ataqatigiit (IA) government, elected on an anti-uranium platform, passed a law banning uranium mining. The effect was immediate: it blocked the giant Kvanefjeld project and sent Greenland Minerals Ltd. (the developer) into legal battle. Local opinion is split: while some Inuit leaders see a mine as a route to jobs and independence, others worry that trucks, spills, and waste would disrupt fishing, hunting and tourism. Most Greenlanders (and all major parties) agree that Greenlanders themselves must decide if and how to develop resources. Environmentalists also sound the alarm on climate and biodiversity. Greenland contains unique ecosystems like the North Water Polynya and harbors a huge fraction of the world’s freshwater in its ice. Any new mining poses risks of pollution to rivers, fjords and the Arctic Ocean. Moreover, paradoxically, exploiting Greenland’s fossil fuels would exacerbate the climate crisis that is melting the island itself. Climate analysts note that policies should balance resource security and climate policy, since unchecked mining in Greenland’s melting environment could cause “further harm” with global impact. Greenland today sits at a crossroads of climate change, great-power rivalry, and the energy transition. Its enormous mineral endowment gives it real economic leverage and strategic relevance – but bringing those resources out is fraught. Recent analyses conclude that “economic ambitions need to be matched by coordinated approaches to climate security, emerging risks and long-term stability in a rapidly changing Arctic.” In practice, this means any race to exploit Greenland must be managed collaboratively, respecting Greenlanders’ rights and fragile environment as much as it chases ores and oil. The stakes are high: a successful Greenland strategy could help the West break China’s metals monopoly and boost Arctic security; a reckless one could damage an ecosystem vital to global climate and blow a hole in Western alliances.
johneb492254456

Greenland’s ice sheet is rapidly melting (as shown above), exposing mineral-rich rock once locked in by ice. Climate change is transforming Greenland’s ice cover: in 2025 it marked its 29th consecutive year of net ice loss, with melt rates far above the 1990s average. Scientists warn the ice sheet is nearing a critical tipping point, whose collapse could raise global sea levels by over 7 meters. The retreating ice and warming temperatures now expose vast resource deposits (from copper to nickel) and open the Northwest Passage for more months each year. As one analysis notes, “melting land and sea ice is making Greenland’s rich mineral and hydrocarbon deposits more accessible”. This long-hidden wealth has drawn a global “treasure hunt” for metals like nickel, cobalt, and rare earths needed for EV batteries and green tech. However, analysts caution that extraction will be extremely challenging: Greenland’s ice-free area is tiny, its terrain rugged, and there are virtually no roads or deep ports. Every ton of ore would have to be barged or flown out, substantially raising costs.Resource Endowment: Rare Earths and Oil
Great Power Interests
Economic Opportunities vs. Environmental and Social Risks
Balancing the Stakes: Opportunities and Risks
Conclusion

The Economy Is Growing — So Why Does Nobody Feel Rich?
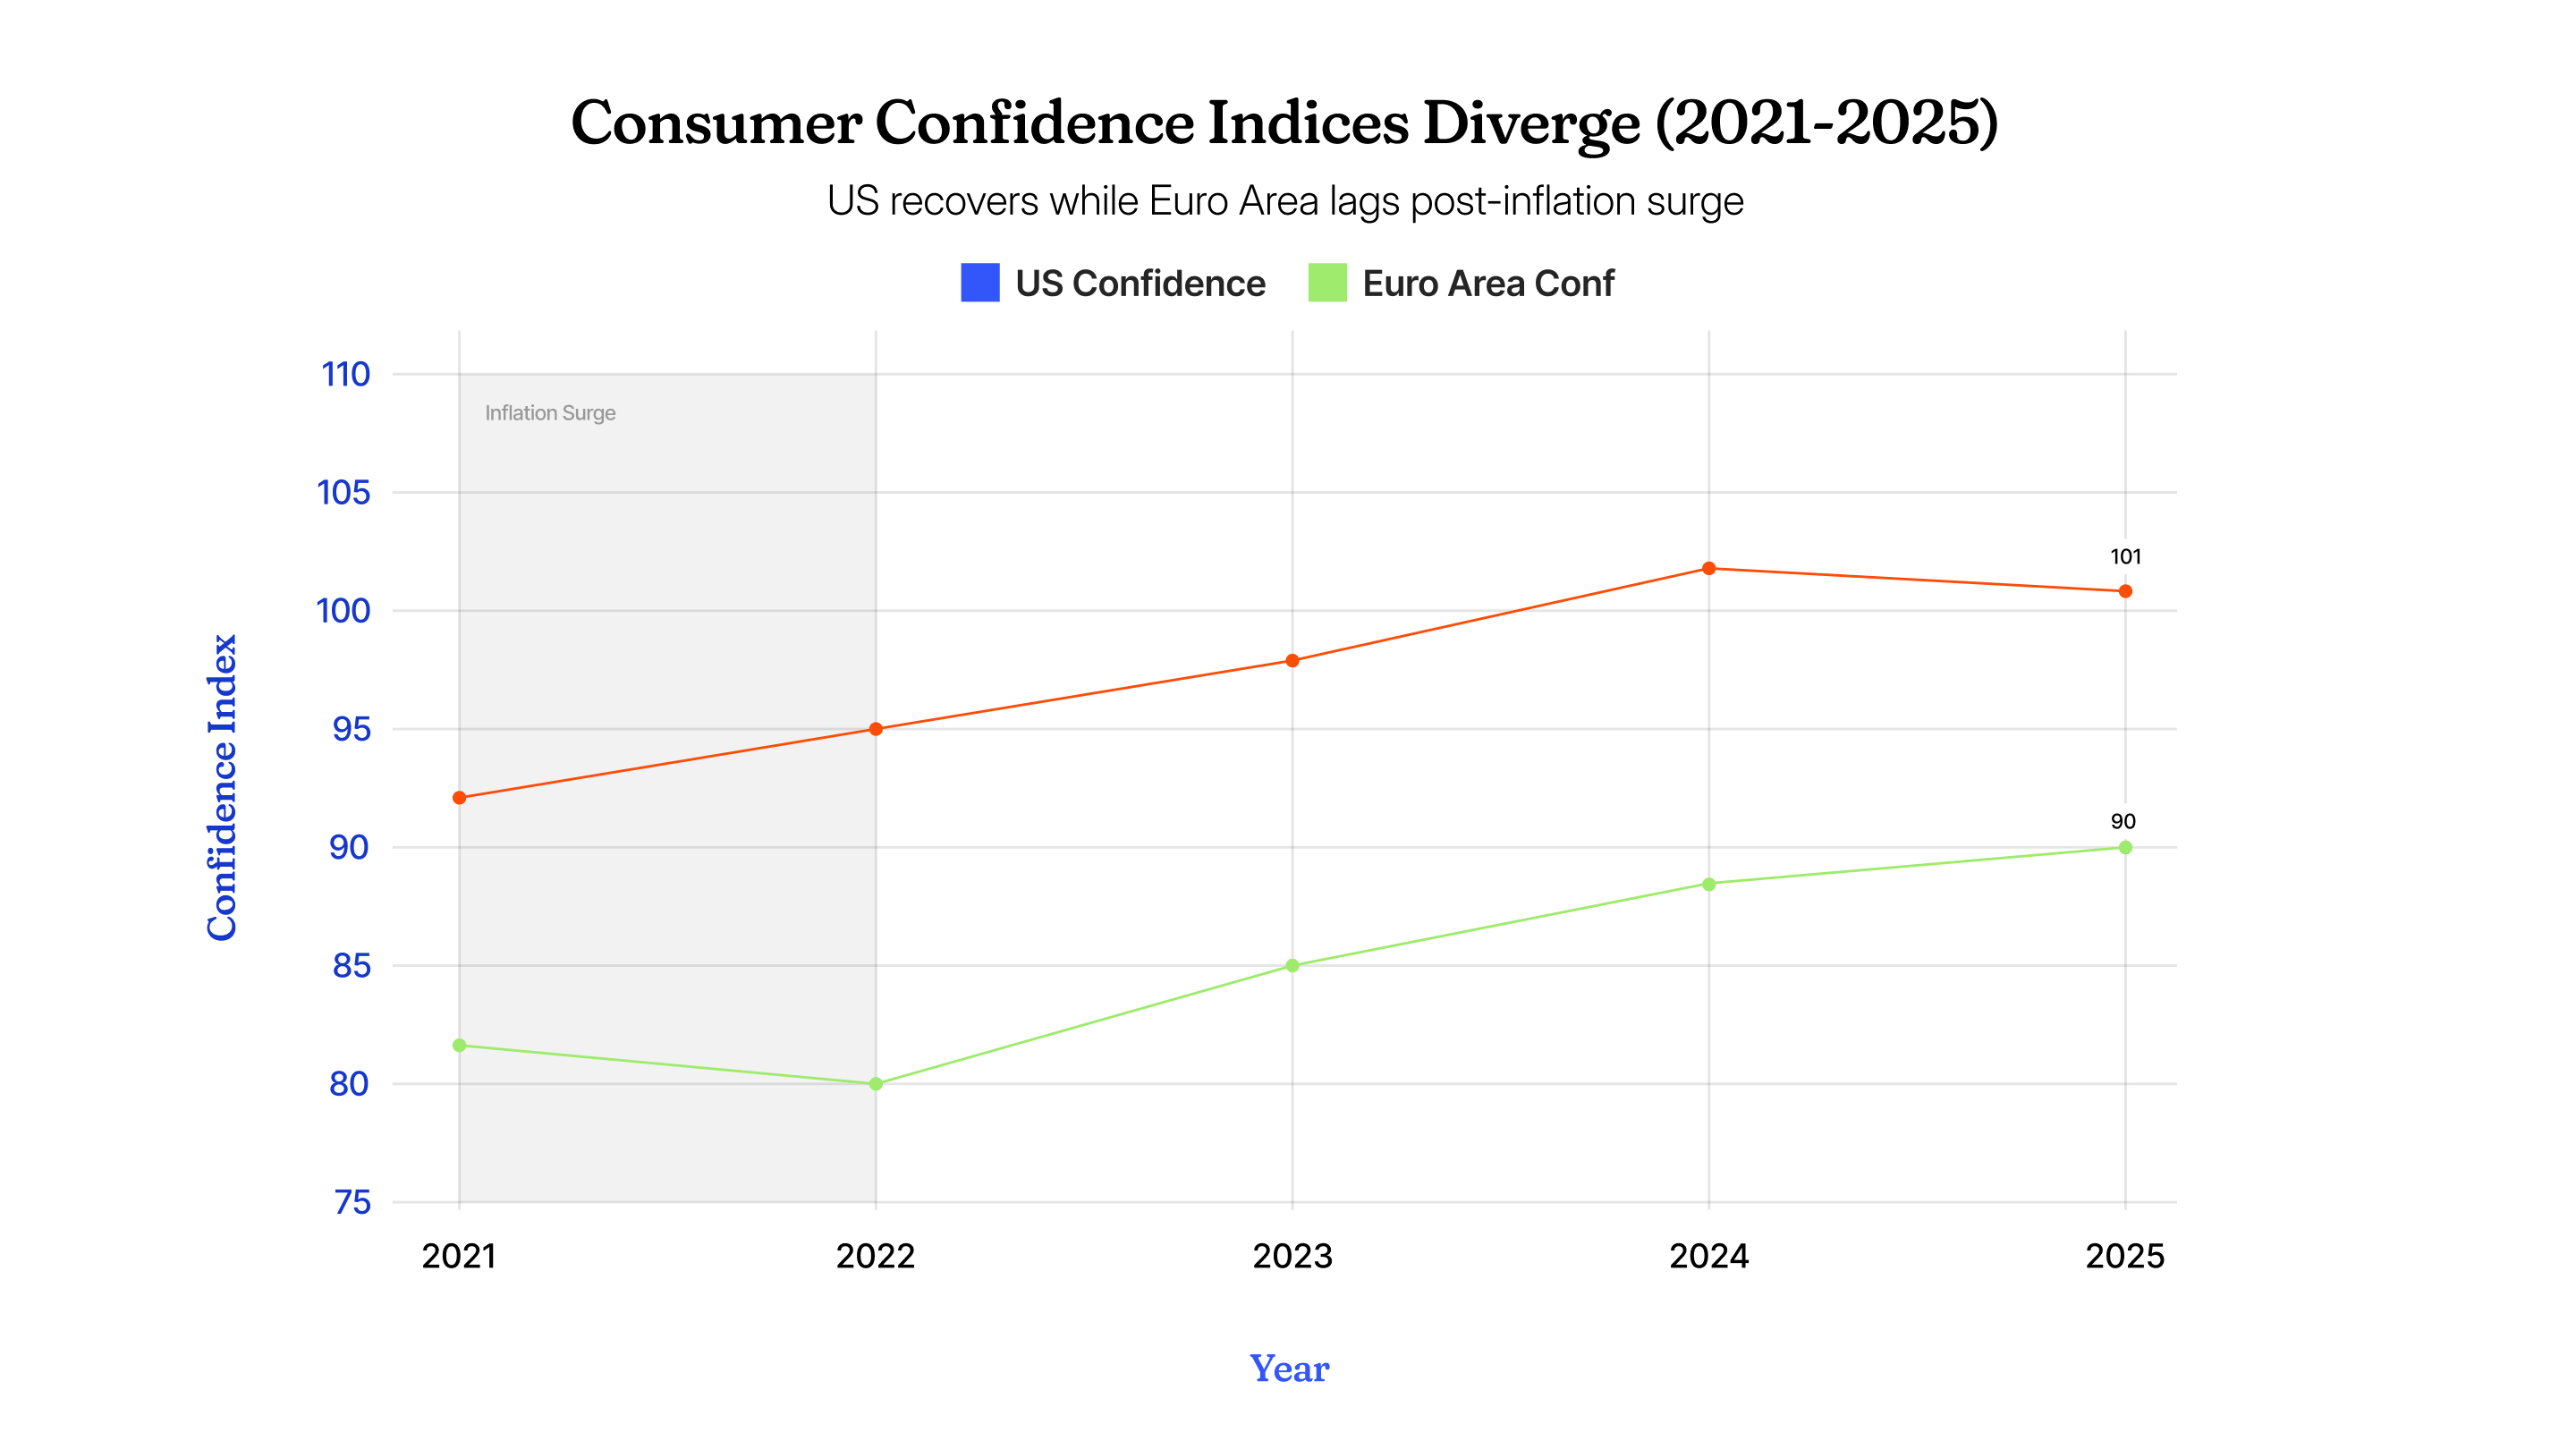
February 18, 2026 by johneb492254456 Global GDP growth held resilient at 3.3% in 2024 according to IMF estimates, with projections for a modest slowdown to 3.2% in 2025 and a forecasted 3.1% in 2026 as trade frictions and policy uncertainties weigh in. Advanced economies expand around 1.5% while emerging markets maintain stronger momentum above 4%. Labor markets stay robust in many places, unemployment remains historically low in key regions, and investments in technology drive some sectors forward. Yet these broad positives mask a deeper reality where households feel squeezed rather than enriched. GDP captures total output but not how gains reach individuals or offset rising costs. Consumer sentiment indices diverge sharply from growth figures, with surveys showing lingering pessimism despite recovery. In major economies, confidence remains below pre-pandemic norms even as output rises, reflecting a “vibecession” where statistics improve but lived experience does not. This puzzle stems from inflation’s lasting impact and uneven benefit distribution, making macro strength feel disconnected from daily finances. Inflation surged post-2021, pushing prices higher across essentials and creating a new cost baseline that erodes affordability. Real wages fell initially but have recovered positively in most OECD countries by 2024-2025, with annual growth around 3.4% in many cases. However, in roughly two-thirds of OECD nations, real wages remain below early 2021 levels before the major inflation wave. ILO data confirms global real wage growth strengthened in 2024, though persistent price levels mean gains feel insufficient against accumulated losses. Headline inflation has cooled, yet prices rarely decline, leaving a “level effect” where everything costs more permanently. Higher interest rates to combat inflation increase debt burdens for mortgages, loans, and credit, reducing disposable income even with steady jobs. Households face tighter budgets as servicing costs rise, turning stable employment into constrained finances. This structural pressure contributes to why growth fails to translate into felt prosperity. Post-pandemic expansion has leaned heavily on financial markets and capital-intensive sectors, boosting asset values disproportionately for owners. In the U.S., the top 1% held 31.7% of wealth by late 2025 per Federal Reserve data, nearing postwar highs and rivaling the bottom 90% combined. Wealth accumulation outstrips broad wage growth, as Bloomberg and World Bank analyses note, widening the perception that economic progress favors few. Wage earners see modest advances while capital gains drive headline figures. The economy grows on paper, but true success depends on translating expansion into everyday security through better purchasing power, fairer distribution, and relief from debt pressures. As sentiment lags output, policymakers face the challenge of ensuring growth benefits households broadly rather than concentrating gains. This shift in focus from aggregate figures to lived experience defines the current cycle, reminding us that economic health is measured not just in GDP, but in whether people feel richer in their daily lives.
johneb492254456

Why FX Policy Innovation Is Becoming a Competitive Necessity for African Central Banks
February 16, 2026 by johneb492254456 Across Africa, central banks are adopting new foreign‐exchange (FX) policy tools to manage volatile currency markets. In early February 2026, Ghana’s central bank unveiled a structured “discretion-under-constraint” FX framework for dollar interventions, and Nigeria’s central bank approved weekly $150,000 dollar sales to licensed Bureau de Change (BDC) operators. These parallel moves – a rule-based auction system in Ghana and expanded retail FX access in Nigeria – respond to a common challenge: global monetary divergence, capital flow volatility, and inflation pressures. African FX policy is becoming more innovative as countries compete to maintain stable exchange rates and attract investment. Currency stability in Africa matters because sharp swings in exchange rates can fuel inflation and economic instability. Ghanaian cedi and US dollar notes. Ghana’s central bank (BoG) has detailed new guidelines for FX spot interventions, announced February 10, 2026. Under this structured discretion-under-constraint approach, the BoG will hold periodic dollar auctions whenever the cedi’s movements fall outside pre-set triggers. Crucially, the framework does not peg the cedi at a fixed rate but aims to smooth out “excess short-term volatility”. In practice, only licensed banks may bid in these auctions (in $500,000 increments), with each bank limited to 20% of any auction’s volume. The auctions use a multiple-price format: banks quote USD bids in cedi terms, and the BoG fills buy or sell orders from the most competitive prices until the announced volume is reached. By imposing clear rules and limits, the new BoG FX framework preserves market-driven price discovery while curbing wild swings. The BoG emphasizes that spot interventions now form part of a broader FX operations framework (alongside reserve accumulation and FX intermediation) to deepen transparency and confidence. At the same time, the central bank explicitly ties this policy to inflation: it notes that stability in the cedi “remains central to inflation control and broader macroeconomic recovery. In effect, Ghana’s structured approach means the central bank retains some discretion to act when needed, but only within a transparent, rule-based system. This balances flexibility and predictability. As one Ghanaian news source explained, the rule-based auctions will “allow the exchange rate to be market-driven while limiting excess short-term volatility – but not eliminating it”. In other words, Ghana is innovating its FX policy by formalizing when and how it intervenes, so that markets can anticipate BoG actions. The hope is that greater clarity and constraints will reduce speculative attacks on the cedi while still accommodating necessary corrections. In contrast to Ghana’s auction model, Nigeria’s central bank (CBN) has tweaked the participants in its FX market. A circular dated February 10, 2026, allows all duly licensed Bureau de Change (BDC) operators to buy U.S. dollars from authorized dealer banks, up to $150,000 per week per BDC. Previously, BDCs had been largely shut out of official channels; this change restores their access (via banks) at prevailing market rates. The stated goal is to improve FX liquidity in the retail segment – helping individuals and small businesses obtain dollars for legitimate needs like travel, school fees, or imported inputs. By widening the base of official dollar buyers, the CBN hopes to narrow the gap between Nigeria’s official and parallel exchange rates, which had widened sharply. The new Nigeria BDC policy comes with strict safeguards. Authorized dealers must conduct full KYC checks on BDC customers, and existing BDC guidelines still apply. Any unsold dollars bought by BDCs must be returned to the market within 24 hours (they are not allowed to hoard foreign currency). Settlement rules ensure all transactions go through bank accounts (not third-party cash) to enhance transparency. In sum, this Nigerian Bureau de Change dollar sales policy is an attempt to combine wider market access with tighter controls: licensed BDCs can once again participate, but under a disciplined quota system. The CBN frames it as part of a broader strategy to “deepen market efficiency, enhance transparency and strengthen the overall functioning of the FX system”. Both the Ghana and Nigeria reforms reflect challenging global conditions. As major central banks (notably the U.S. Federal Reserve) raised interest rates in 2022–2025, emerging markets faced capital outflows. Economists note that higher U.S. rates make dollar assets more attractive, pulling capital away from markets like Africa. This leads to rapid outflows from African markets, causing local currencies to weaken and markets to become volatile. The Habtoor Research analysis explains that when U.S. interest rates rise, “investment returns in the U.S. become more attractive… [which] draws capital away from emerging markets, including those in Africa”. The result has been sharper currency swings and inflation pressures. Indeed, to counter these forces, many African central banks have tightened policy themselves. The same analysis notes that African central banks often raise their own rates “to preserve foreign investments and curb capital flight, thus preventing further currency depreciation and keeping inflation in check”. In this era of monetary divergence, stable and flexible FX policies are seen as crucial. Central banks can no longer rely on benign external conditions. Instead, they need tools to buffer their economies from global shocks. Ghana’s auction framework and Nigeria’s BDC scheme are examples of such FX market innovation in Africa. By intervening in a more rule-based way or by expanding official dollar supply, these countries seek to manage the volatile capital flows and import costs that come with global rate cycles. For emerging economies, FX stability is not just a technical concern – it’s fundamental to macroeconomic health. A volatile or collapsing currency can rapidly import inflation, since most food, fuel, and capital goods are priced in dollars. Ghana’s authorities have been explicit: stable exchange rates are “central to inflation control”. In late 2025, Ghana’s inflation rate fell sharply (to around 5%), driven largely by a stronger cedi and growing foreign reserves. Citing BoG sources, one report notes that a 40%-plus appreciation in the cedi over 2025 (backed by $13.8B in reserves) helped tame imported price pressures. Nigeria faces similar dynamics. After years of dual exchange rates, analysts warned that the FX market distortions had “become intolerable,” deterring foreign investment[4]. In a unified system, all players rely on one market, which reduces arbitrage and builds confidence. Indeed, Nigeria’s overhaul of FX pricing in 2024–2025 was explicitly aimed at ending an arbitrage-rich system that “hampered foreign direct investment”. In short, currency stability underpins growth. It anchors inflation expectations, lowers borrowing costs, and makes trade and investment planning more reliable. When central banks innovate – for example, with transparent auction systems or by ensuring dollars reach ordinary businesses through BDCs – they are trying to prevent the wild swings that can trigger economic crises. As one commentator warned in 2025, slipping back into ad hoc interventions or policy inconsistency could “undo” the gains of reform[22]. This underscores the point: investors and businesses demand credible, stable FX regimes in emerging markets. FX policy innovation in Africa is fast becoming a competitive necessity for central banks. In a global environment where money can flow quickly into or out of countries, a central bank’s credibility depends on effectively managing its currency market. Ghana and Nigeria’s recent measures reflect this urgency. By adopting more structured, transparent interventions, these countries aim to make their FX markets more attractive and stable than those of other countries. The new Bank of Ghana FX framework and Nigeria’s BDC dollar sales rule show how policymakers are tailoring tools to local needs – rule-based auctions for Ghana and expanded retail access for Nigeria. Looking ahead, other African central banks are likely to watch and adapt. If these innovations succeed in smoothing volatility and anchoring inflation, they could set examples continent-wide. Ultimately, maintaining currency stability in Africa’s emerging markets is key to sustaining growth and investment. As external pressures (like divergent global rates and volatile capital flows) continue, central banks will need to keep innovating their FX policies. The goal is clear: stable, predictable exchange rates that support price stability and economic recovery. In the words of Ghana’s central bank, deepening confidence in the FX market is “central to inflation control” – a lesson that resonates across Africa today.
johneb492254456

Bank of Ghana FX Framework: Structured Auctions for Stability
Nigeria Bureau de Change Dollar Sales: $150k Weekly Cap
Global Monetary Pressures and Capital Flows
Why Currency Stability Matters in Emerging Markets
Conclusion: A Competitive Necessity

Love Across Borders: How Stablecoins Are Quietly Powering Modern Remittances
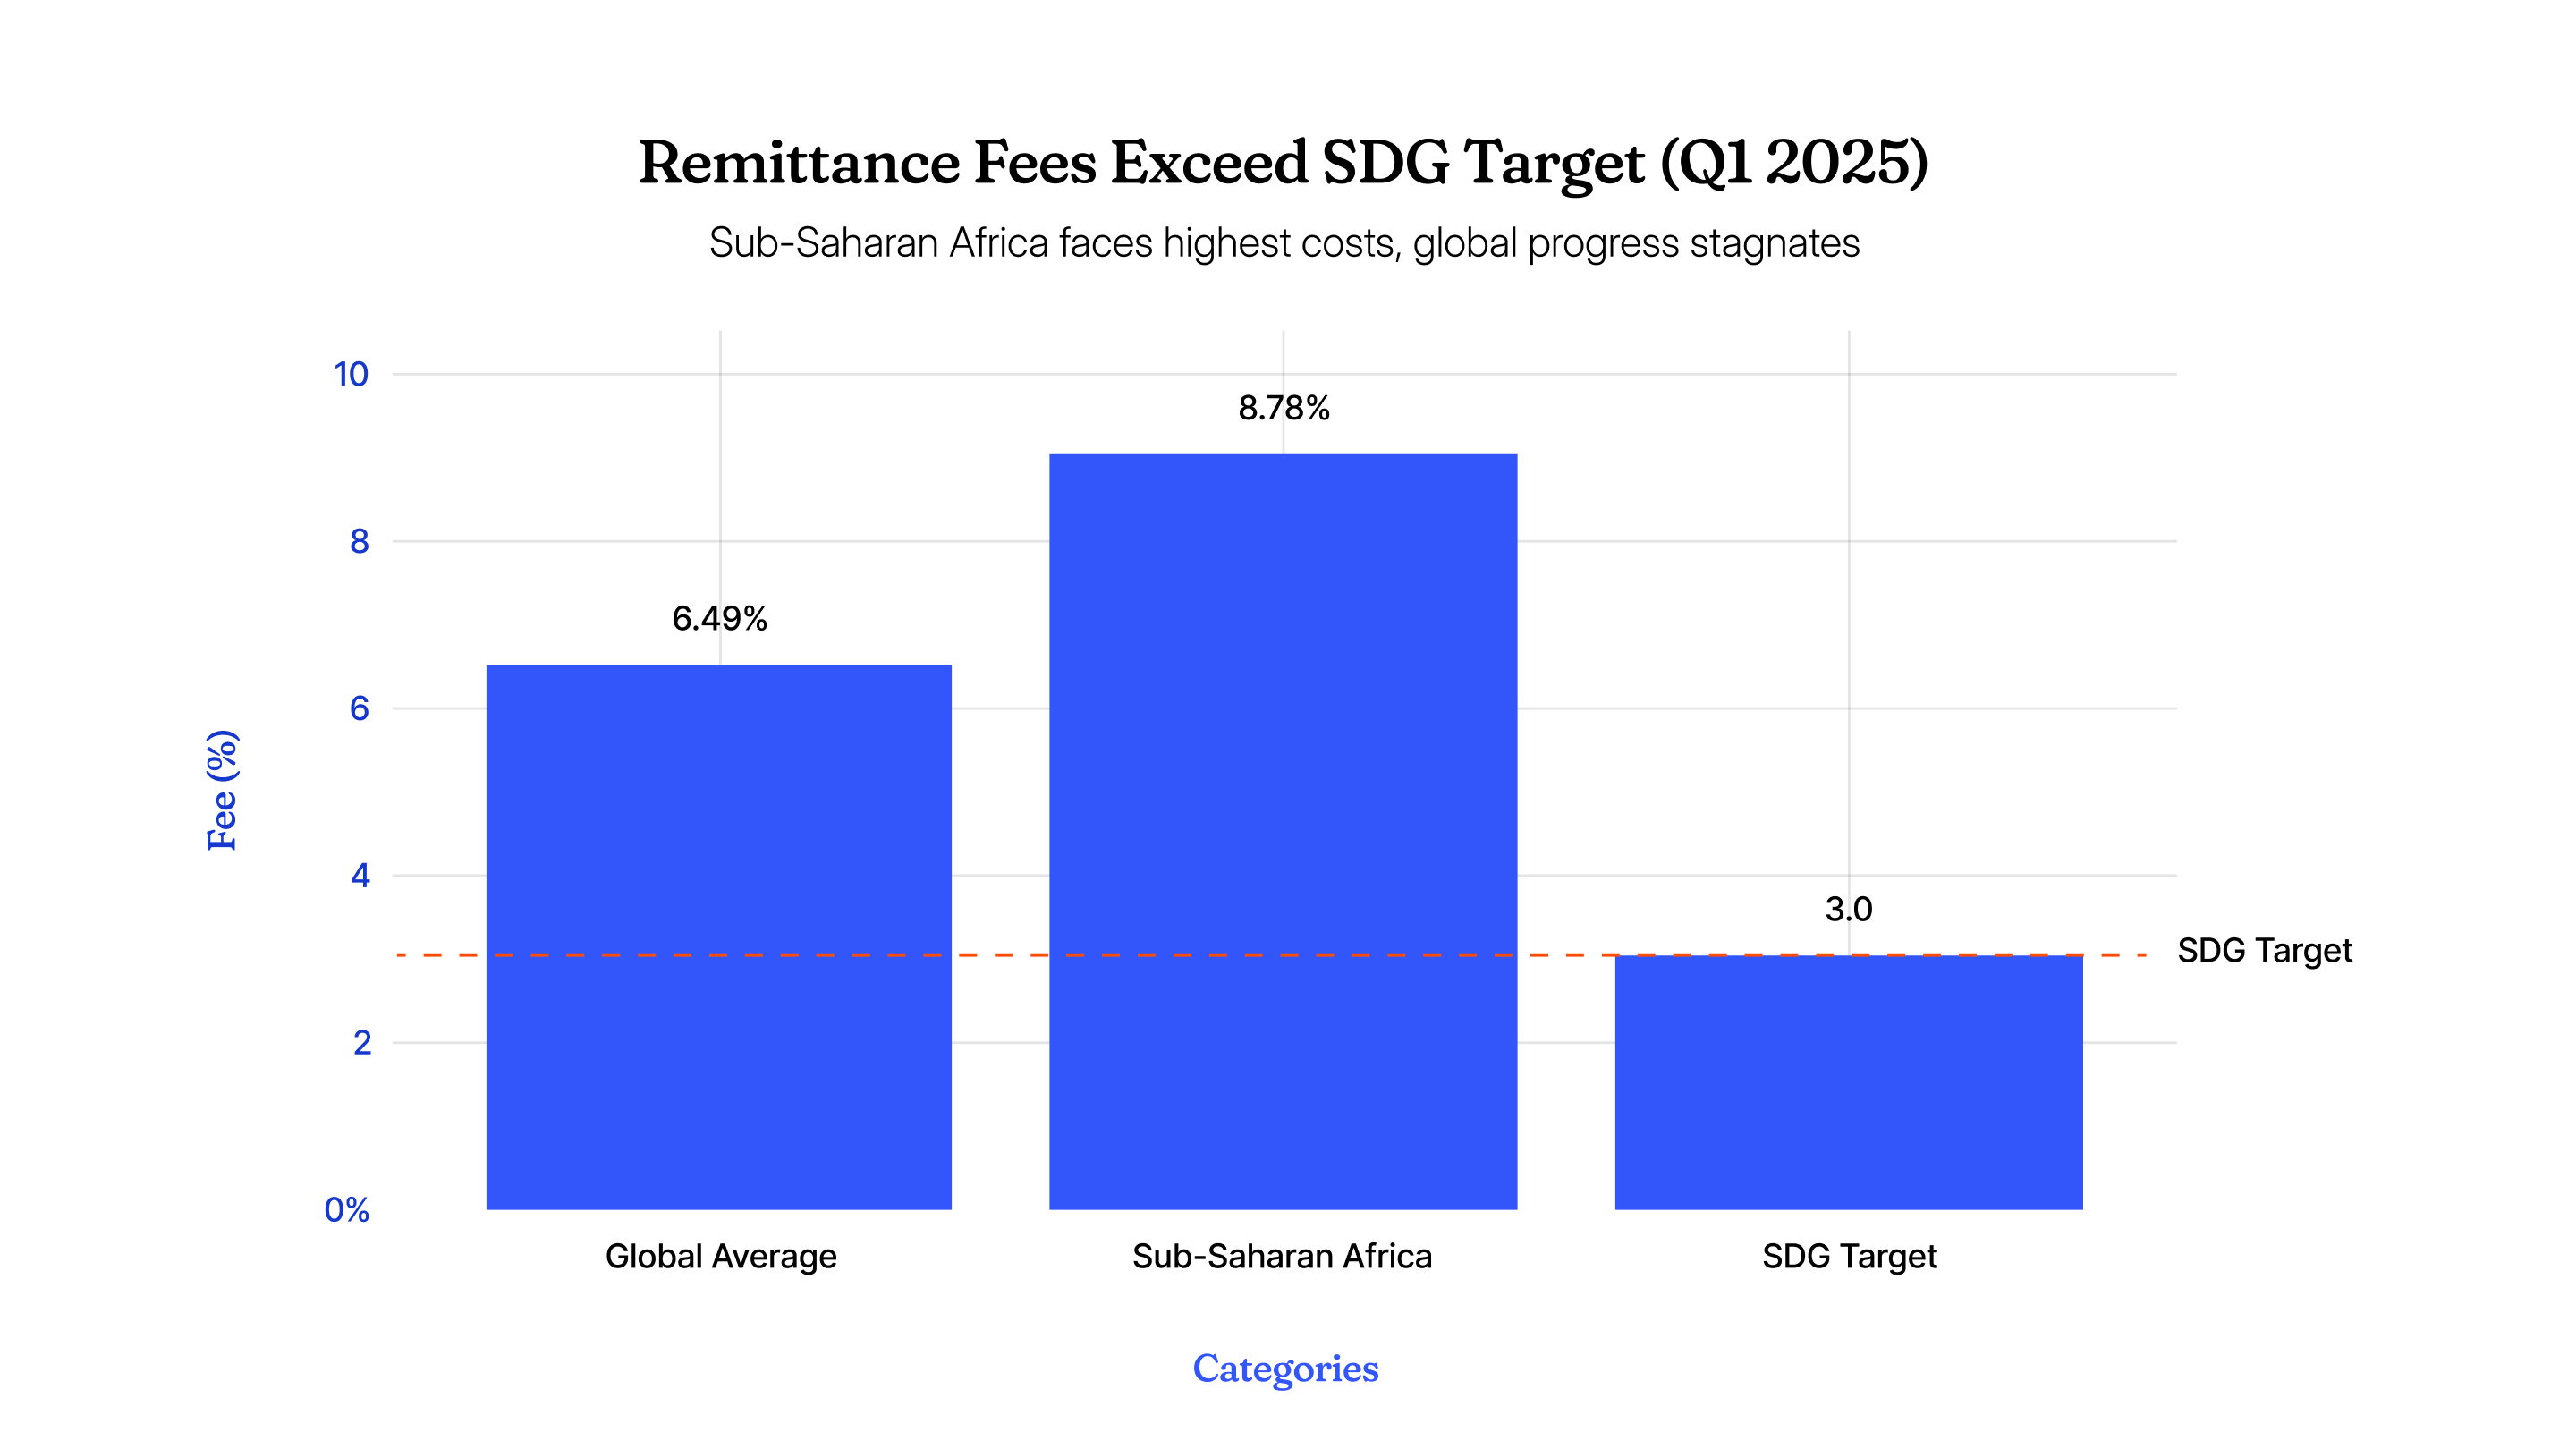
February 11, 2026 by johneb492254456 Remittances represent more than money; they carry love, support, and hope from one country to another. For millions of families separated by borders, sending funds home has long meant high costs, long waits, and lost value. Stablecoins, digital currencies designed to maintain a stable value, are quietly but powerfully changing this by making transfers faster, cheaper, and more reliable. This presentation explores the human side of this shift and why it matters today. Cross-border remittances total hundreds of billions of dollars each year, supporting families in low- and middle-income countries far more than foreign investment or aid in many cases. Yet the process remains burdensome. The World Bank reports that the global average cost to send remittances stayed around 6.49% in 2025, well above the global target of 3%. In regions like Sub-Saharan Africa, fees often rise, sometimes to 8-9%. Delays of several days are common due to multiple banks and intermediaries involved in correspondent networks, plus unpredictable foreign exchange spreads that reduce what recipients actually get. These frictions hit hardest in corridors where people rely on every dollar or peso for essentials like food, education, and healthcare. Stablecoins cut remittance times from days to minutes and slash fees dramatically, often below 1% for the blockchain portion, compared to traditional averages over 6%. In high-adoption areas, this saves households significant amounts annually. Recipients can hold funds digitally or convert to local currency when ready, bypassing opaque intermediaries. Chainalysis highlights how stablecoins serve as a hedge in volatile economies and enable reliable cross-border payments. Adoption thrives in regions facing economic pressures. In Sub-Saharan Africa, stablecoins make up a large portion of crypto activity, with Chainalysis noting 43% of transaction volume in some areas tied to remittances and payments. Latin America sees strong use in corridors like the U.S.-Mexico, where platforms process billions. Asia, including India and the Philippines, integrates stablecoins for diaspora transfers amid large remittance inflows. These areas show grassroots demand—people choose stablecoins for speed and reliability in high-inflation or currency-constrained settings. Reports from Chainalysis and others confirm this practical, need-driven growth, not hype. Stablecoins often work quietly within familiar apps and wallets, not as a full replacement for banks but as efficient rails underneath. Users send via platforms that handle conversions seamlessly, so the experience feels simple. Regulatory steps, like the U.S. GENIUS Act in 2025 and frameworks in other regions, add transparency and trust through reserve requirements and audits. This evolution turns remittances from a slow banking service into a modern payments utility faster, clearer, and more aligned with real human needs. As more fintechs and institutions adapt, expectations for cross-border money movement rise toward what families deserve. Stablecoins are reshaping remittances by prioritizing practicality, delivering more value where it matters most. This quiet transformation empowers families across borders, reduces exclusion, and fosters financial resilience in challenging economies. While challenges like regulation and access remain, the momentum points to broader change. Remittances evolve into something more inclusive and efficient, staying true to their core purpose: connecting people with care and support. The future looks clearer, faster, and more human-centered.
johneb492254456

 Stablecoins maintain consistent value by pegging to assets like the U.S. dollar, making them unlike volatile cryptocurrencies. Popular ones include USDT and USDC, which together process massive volumes monthly. Chainalysis data from 2025 shows stablecoins surging in use for practical needs rather than speculation. They operate on blockchain networks that enable near-instant, 24/7 transfers without relying on traditional banking layers. This creates predictability; senders know exactly how much arrives, and recipients avoid surprise deductions. Adoption grows strongest where local currencies face inflation or access to hard currency is limited, turning stablecoins into a bridge for everyday financial needs.
How Rules of Origin Are Distorting Global Commerce
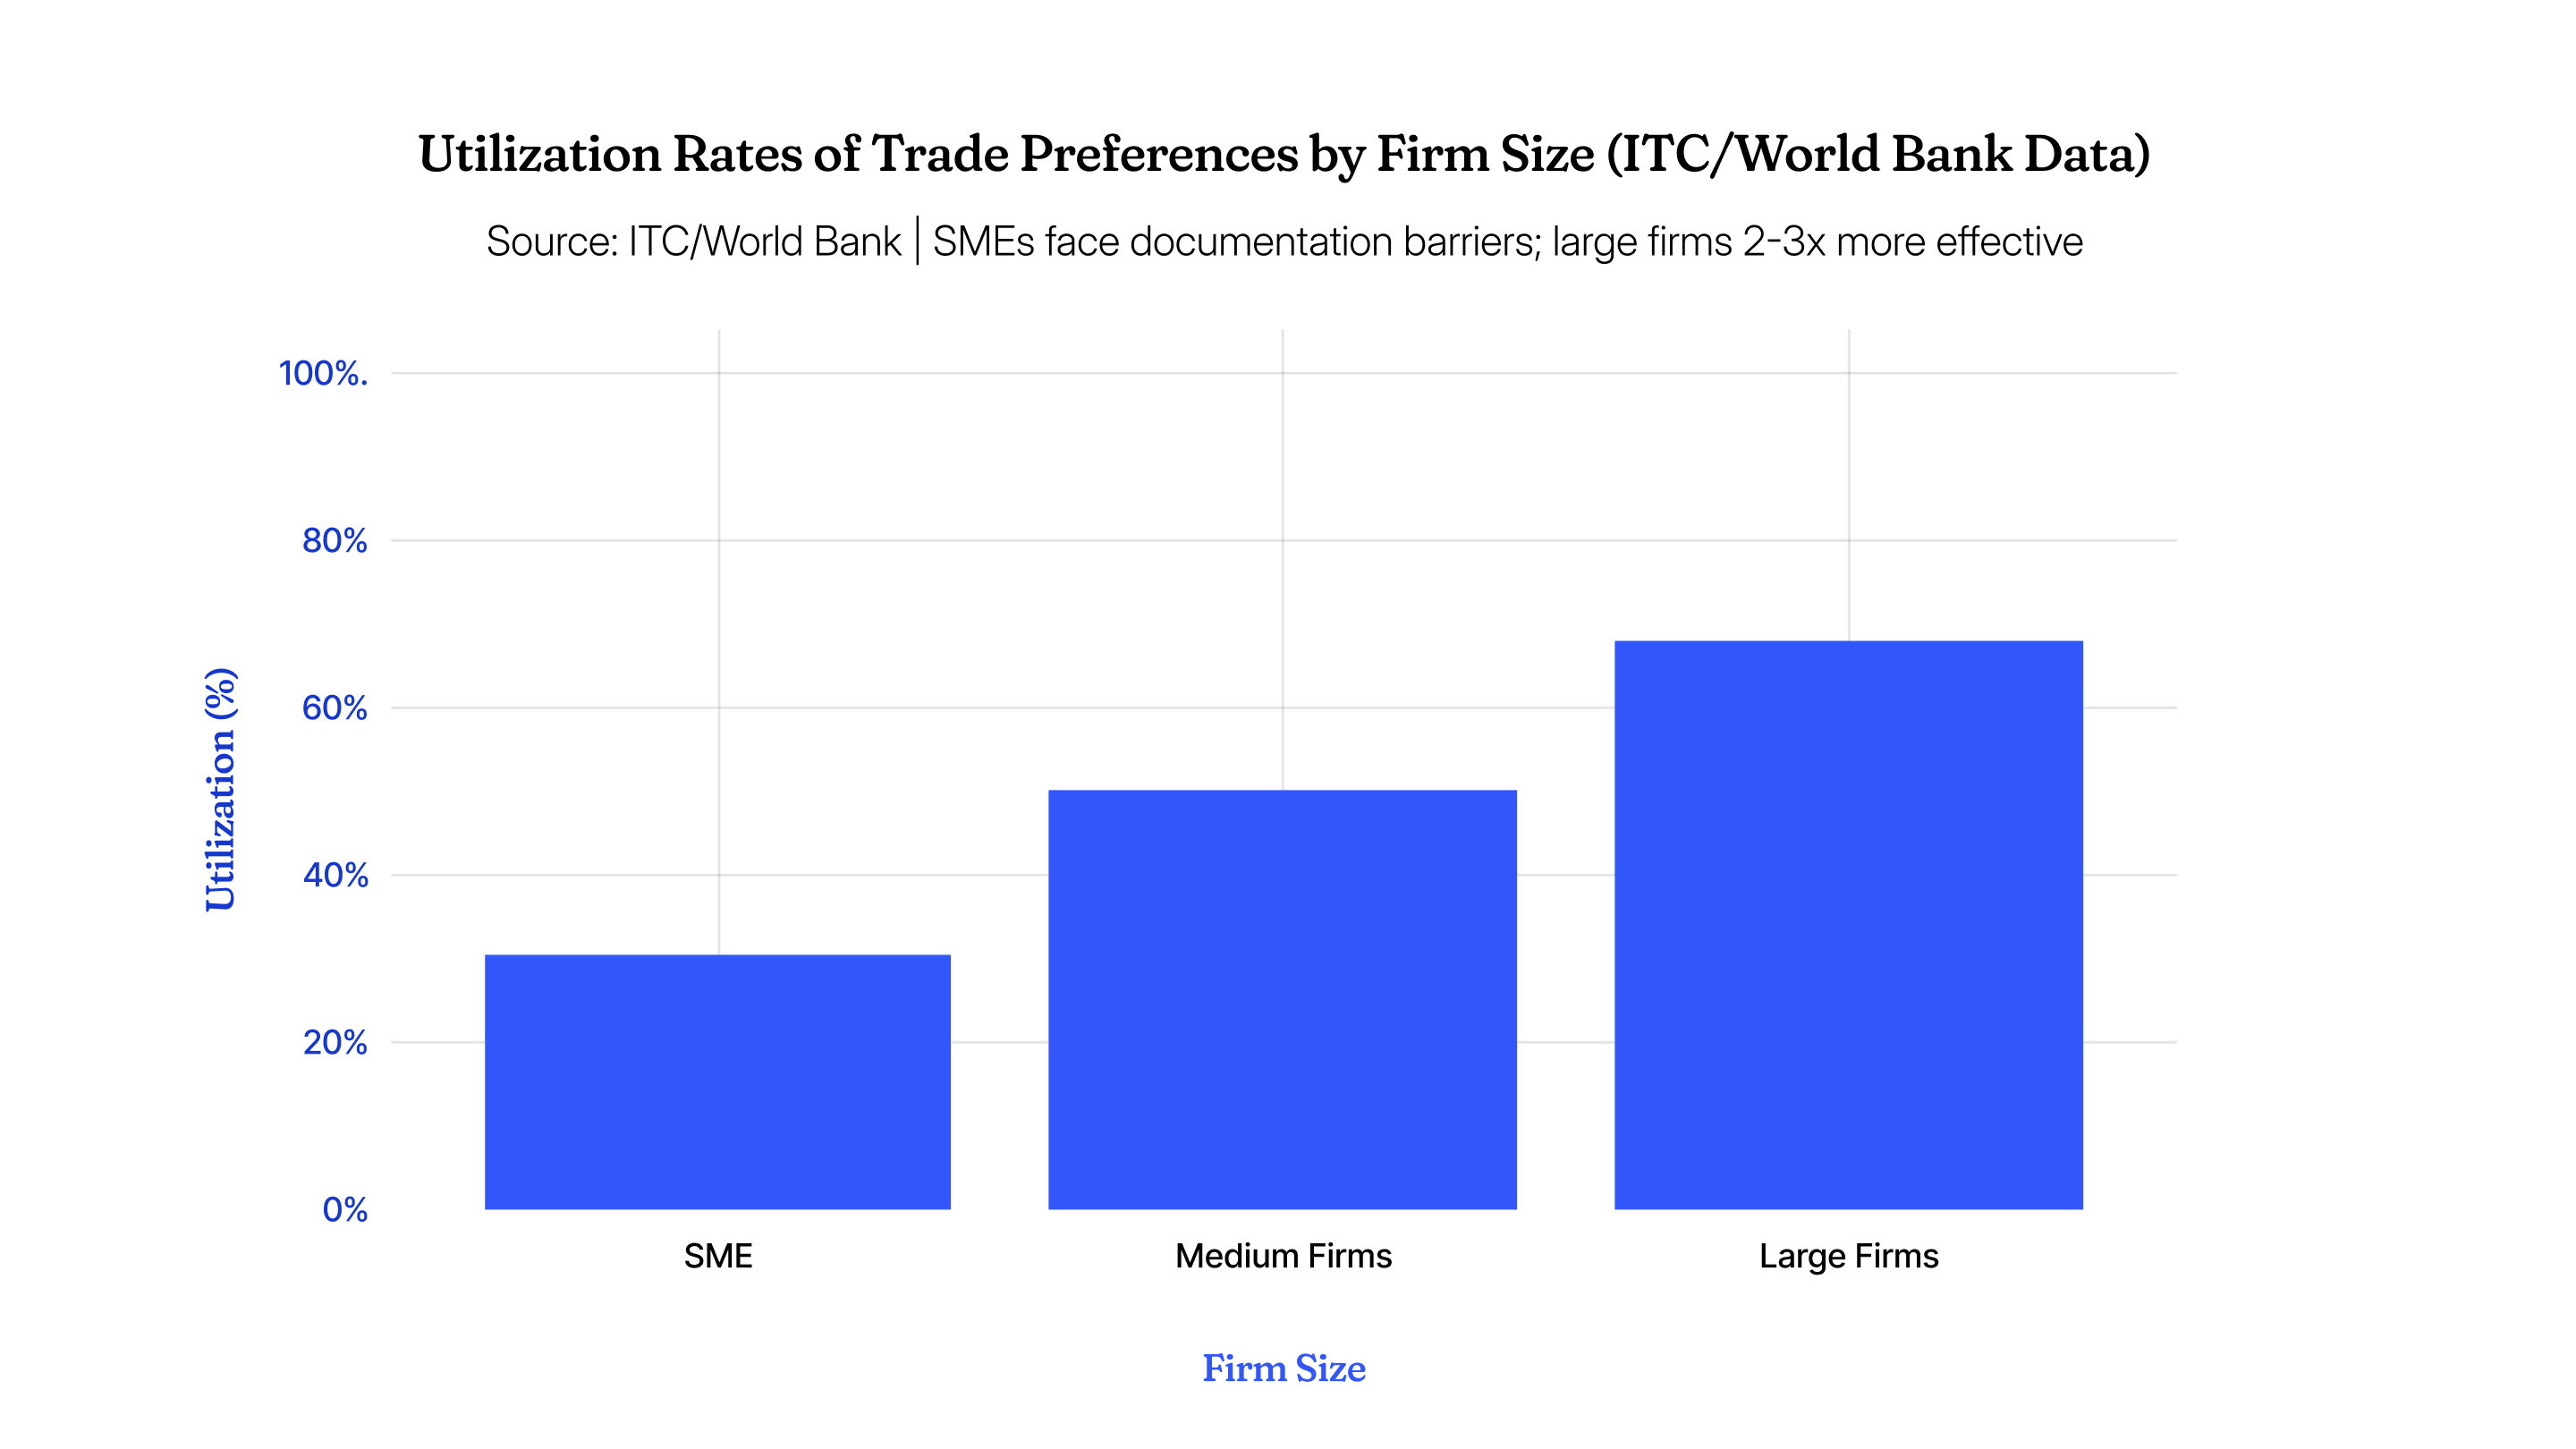
February 4, 2026 by johneb492254456 Global trade is often discussed in terms of tariffs, trade wars, and geopolitical alliances, yet some of the most powerful forces shaping commerce operate quietly in the background. Rules of Origin sit at the center of this unseen architecture. They determine which goods qualify for trade benefits and which do not, influencing prices, supply chains, and access to markets without ever making headlines. As global production becomes more fragmented, these rules increasingly shape trade outcomes in ways most consumers and businesses never fully see. Rules of Origin exist to define the national identity of goods in a world where production spans borders. They establish criteria to determine whether a product is considered domestic or foreign for tariff, quota, and trade preference purposes. These criteria can be based on where a product was last substantially transformed, the amount of local value added, or whether specific manufacturing processes occurred within a member country of a trade agreement. Institutions such as the World Trade Organization and regional trade blocs emphasize that these rules are essential for preventing trade deflection. In today’s trade environment, Rules of Origin increasingly distort decision-making. Companies often reorganize production not to improve efficiency or reduce costs, but to satisfy technical origin thresholds. Manufacturing steps may be relocated solely to qualify for preferential treatment, even if this increases operational complexity. Bloomberg trade analysis has highlighted how firms absorb higher logistics and compliance costs simply to avoid losing tariff advantages. This shift creates a paradox where compliance strategy overrides economic logic. Trade outcomes become less about productivity and more about legal interpretation. Large multinationals often have the legal teams and trade specialists needed to navigate complex origin requirements. Smaller exporters and importers do not. Reports from the International Trade Centre show that small and medium-sized enterprises are significantly less likely to utilize trade preferences because of documentation burdens and uncertainty around compliance. As a result, the benefits of free trade agreements accrue unevenly. This imbalance quietly reinforces market concentration. Firms with scale and regulatory expertise gain an advantage, while smaller players face higher effective trade barriers. In this way, Rules of Origin shape not only cross-border trade flows but also competition within markets. The growing influence of Rules of Origin reflects a broader shift in global trade. Market access is no longer determined solely by price or quality but by regulatory alignment and administrative precision. IMF and World Bank assessments increasingly note that non-tariff measures now pose greater barriers to trade than tariffs themselves. Rules of Origin sit squarely within this category. For consumers, this contributes to higher prices and fewer choices. For businesses, it introduces uncertainty and raises the cost of cross-border expansion. Trade becomes slower, more fragmented, and more dependent on legal interpretation than economic fundamentals. As global trade agreements expand and supply chains continue to reconfigure, Rules of Origin will play an even larger role in determining who benefits from globalization and who does not. Understanding these rules is no longer limited to trade lawyers or customs officials. It has become essential knowledge for manufacturers, importers, policymakers, and even consumers trying to understand why goods cost more or arrive later. The future of trade will not be shaped only by grand geopolitical statements or headline-grabbing tariffs. It will be shaped in the fine print, where Rules of Origin quietly decide access, advantage, and exclusion in the global economy.
johneb492254456

 Beyond commerce, Rules of Origin have taken on strategic importance. Governments increasingly use them to influence supply chain geography without issuing explicit bans. By tightening origin requirements or redefining what constitutes sufficient transformation, countries can reduce dependence on certain regions while remaining aligned with international trade rules. Policy analysis from think tanks such as the Peterson Institute and Bruegel has shown how these mechanisms subtly redirect sourcing away from politically sensitive suppliers. This approach allows states to pursue economic security objectives quietly.

A Strong Dollar Is Hurting Importers — Even When Prices Look Cheaper
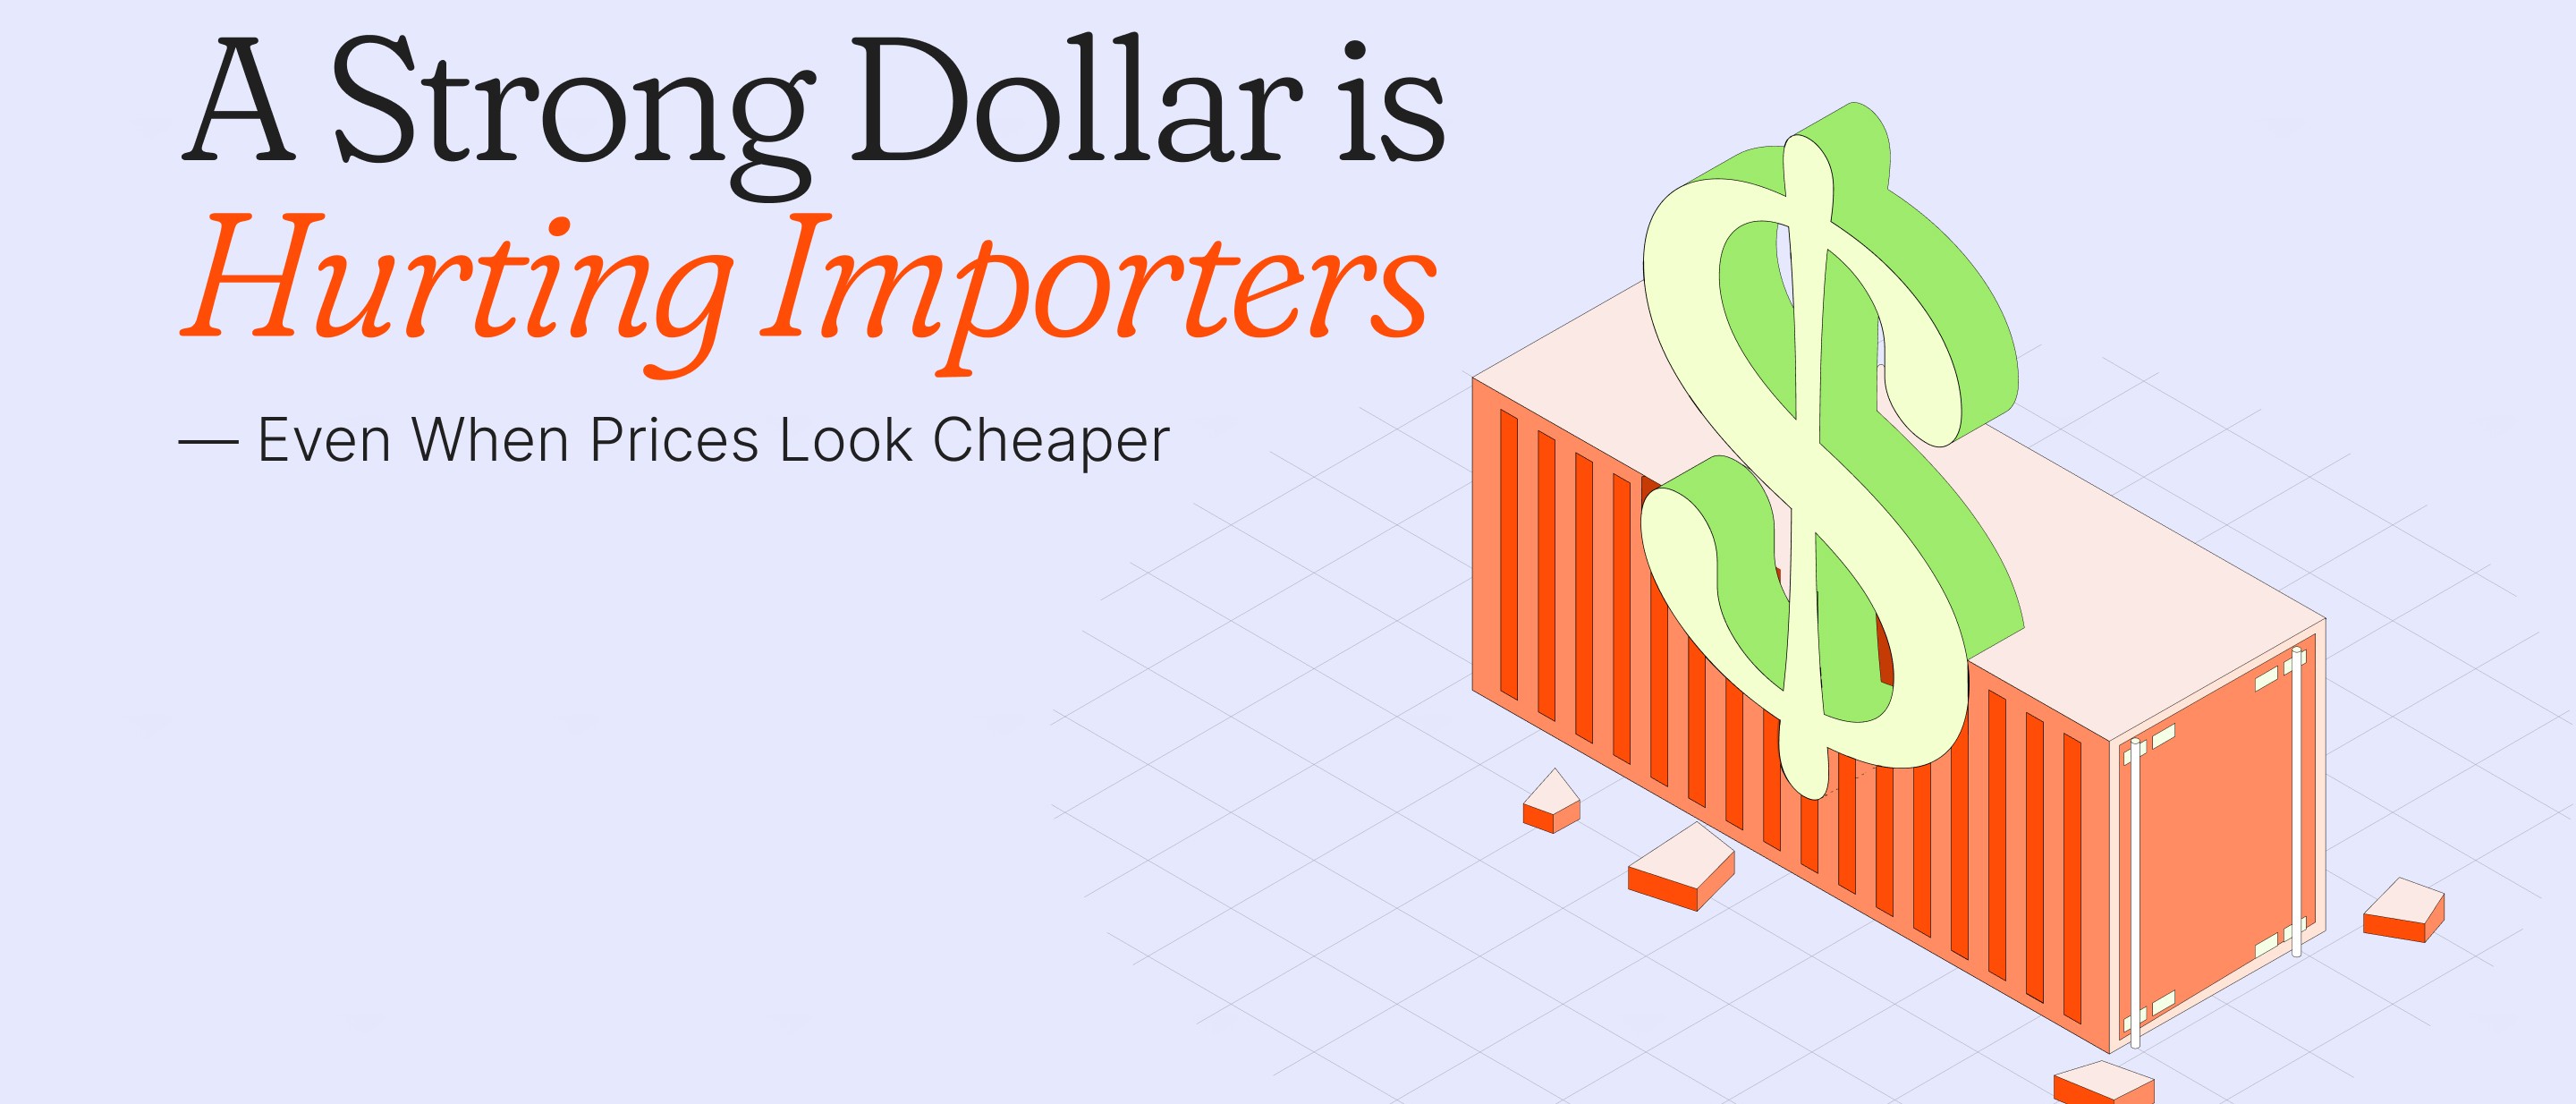
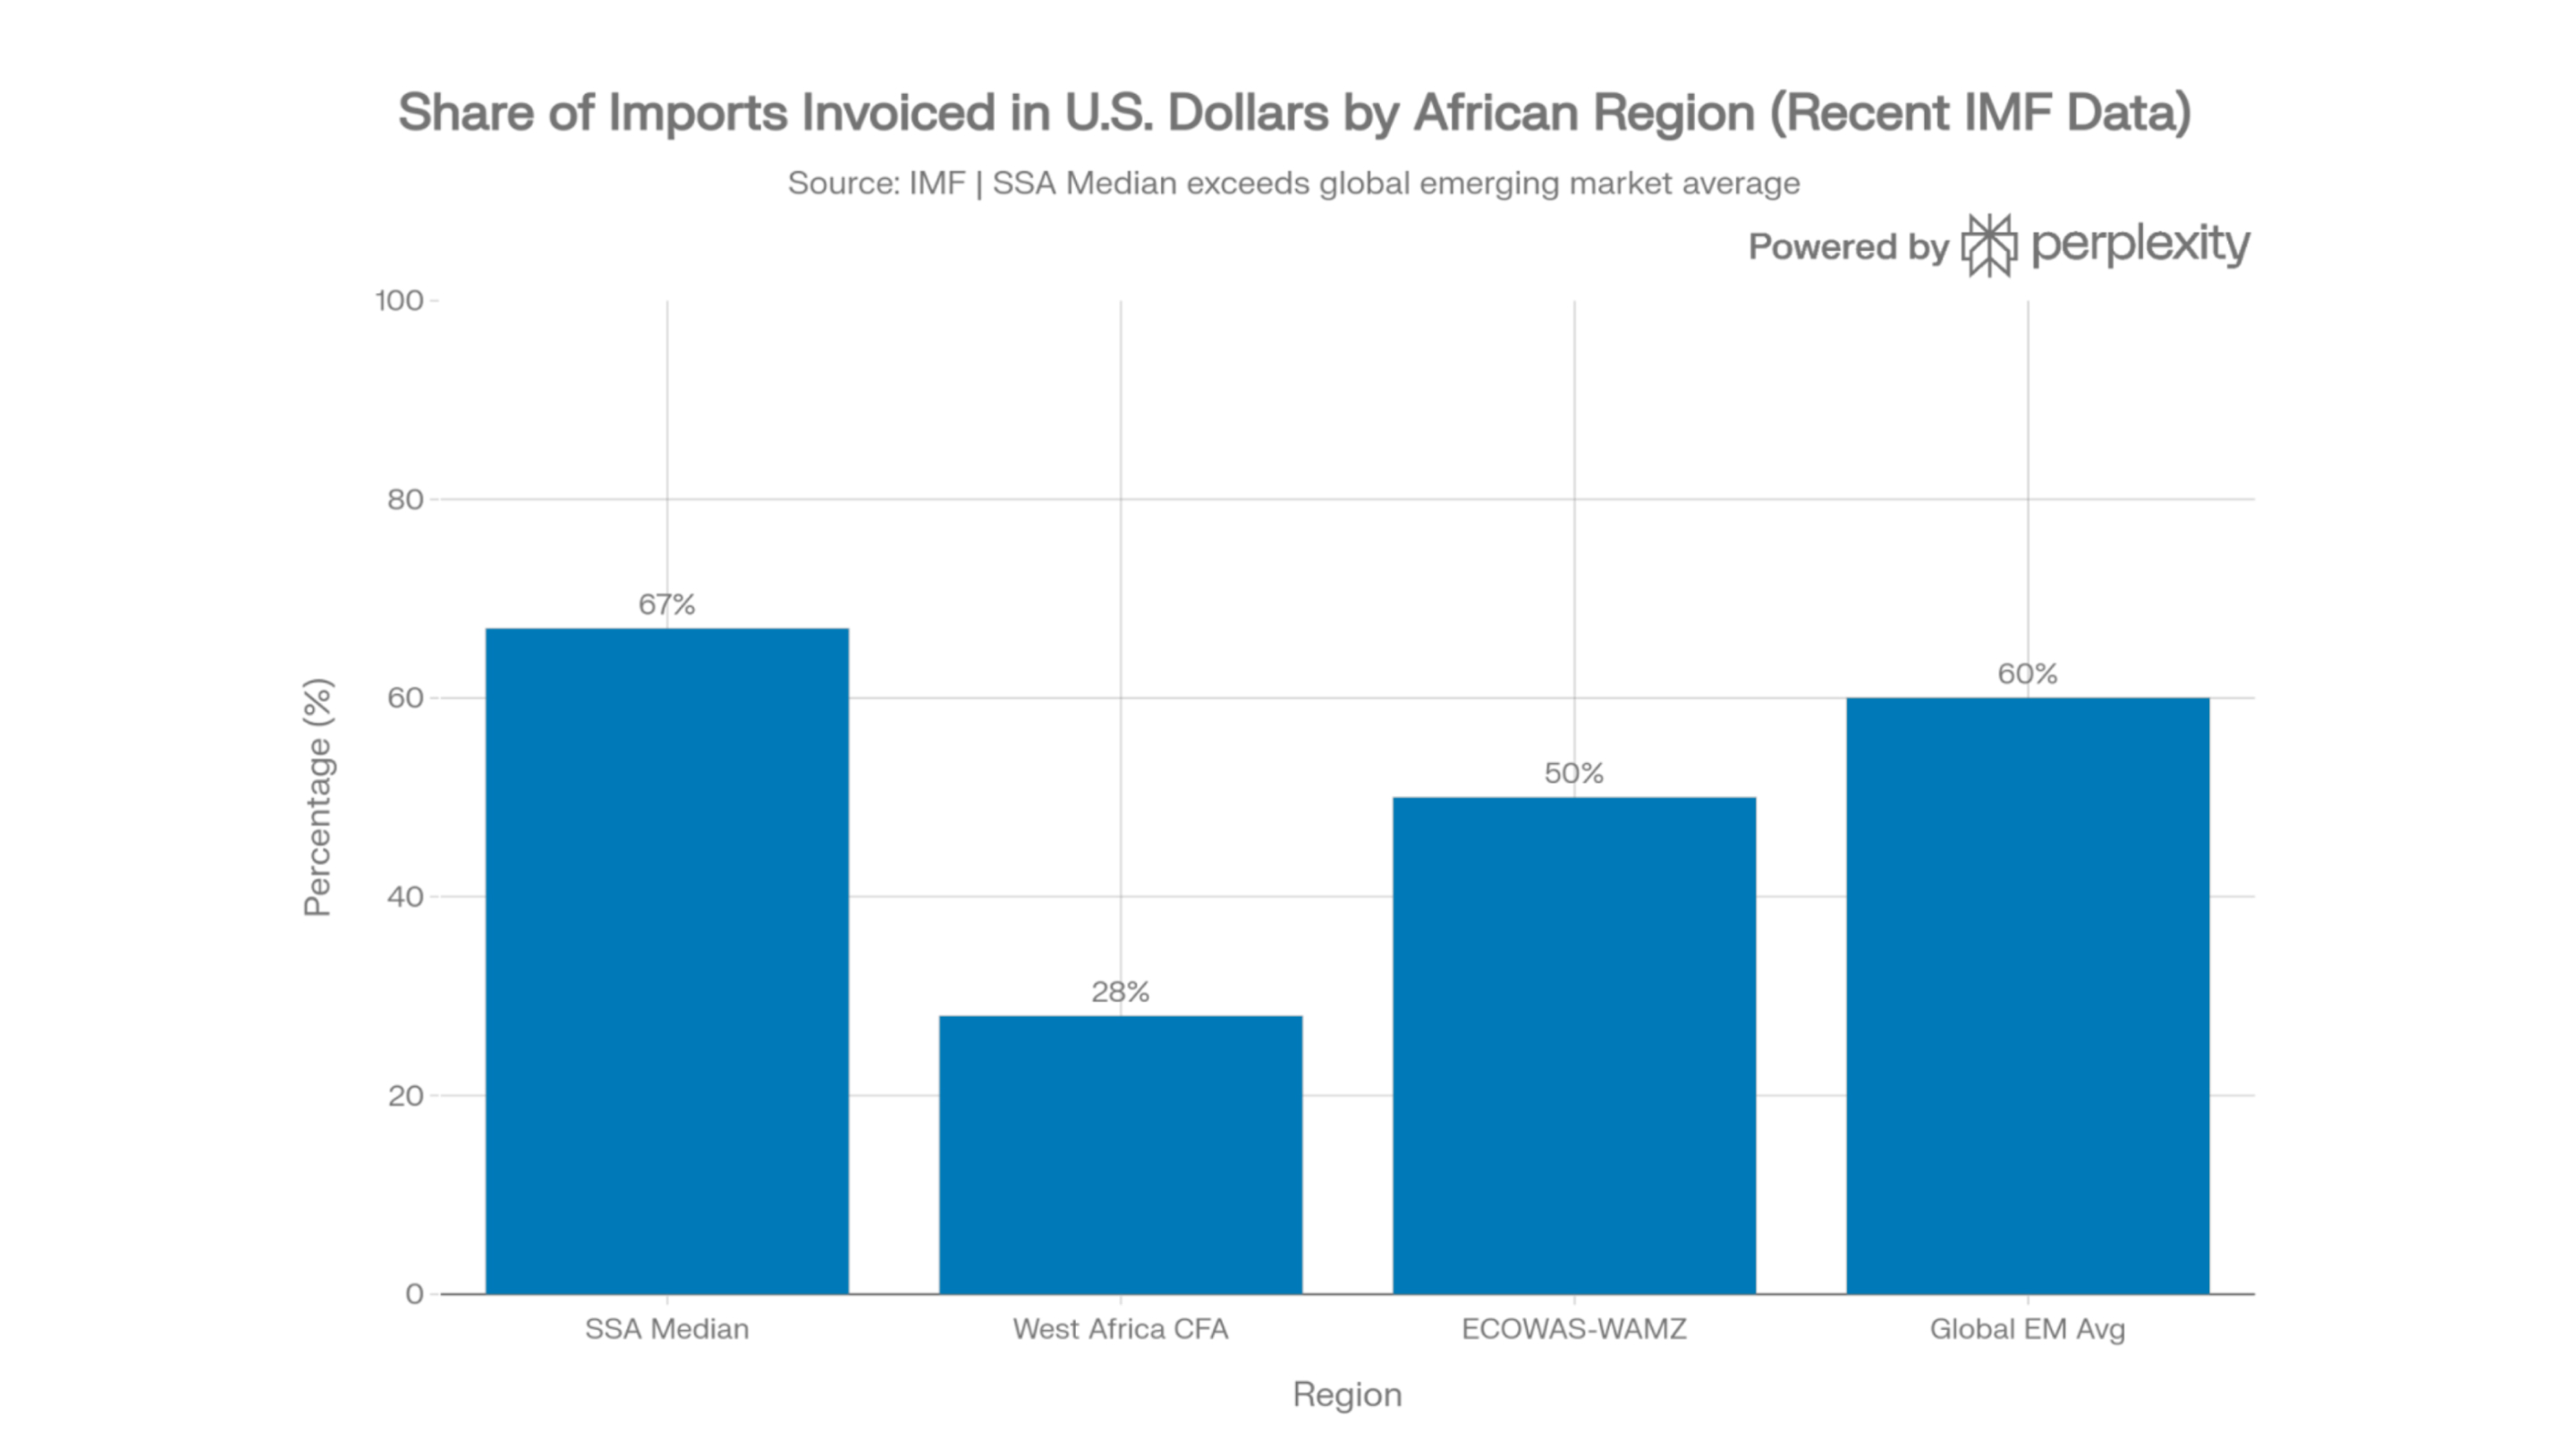
January 28, 2026 by johneb492254456 The fundamental concept that a stronger U.S. dollar benefits importers by increasing their purchasing power often fails to materialize for African businesses. For companies operating in regions like Sub-Saharan Africa, the U.S. dollar is not just a currency but a primary invoicing vehicle for over 80% of imports. Between 2022 and 2025, even as global commodity prices saw periods of cooling, the simultaneous depreciation of local currencies like the Nigerian Naira, Kenyan Shilling, and Ghanaian Cedi meant that the “local currency price” of goods rose sharply. This phenomenon, often referred to as imported inflation, ensures that the theoretical discount of a strong dollar is immediately consumed by the shrinking value of the domestic currency used to acquire those dollars. The promise of cheaper imports assumes that suppliers maintain stable prices and that exchange rate benefits reach the end-user. However, International Monetary Fund reports indicate that global suppliers frequently adjust their dollar-denominated price lists upward to hedge against the volatility of emerging market currencies. For an African business importer, the nominal price on a Proforma Invoice might look stable, but the cost of clearing that invoice in local terms becomes a moving target. Furthermore, the prevalence of dollar-based invoicing means that African importers bear 100% of the currency risk, as most international exporters refuse to settle in local African denominations, effectively shifting the burden of dollar strength entirely onto the buyer. The era of a strong dollar between 2022 and 2025 coincided with aggressive monetary tightening by the U.S. Federal Reserve, which forced African central banks to raise their own interest rates to defend their currencies. For a business importer in Africa, this created a double-edged sword: not only did the dollar become more expensive to buy, but the cost of borrowing local currency to purchase those dollars also skyrocketed. Data from the World Bank suggests that the average cost of business loans in many African nations exceeded 20-25% during this period. These high interest rates effectively cancel out any savings from lower global prices, as the cost of financing the “time-to-market” for imported goods becomes a dominant expense. To protect themselves from further currency slides, sophisticated importers turn to financial hedging tools such as forward contracts and options. However, in a high-volatility environment, the “premium” or cost of these hedges increases dramatically. For many African importers, the cost of securing a forward contract in 2024 became so high that it nearly equaled the expected loss from further currency depreciation. This leaves businesses with a difficult choice: pay a guaranteed high fee for protection or remain exposed to the market. In many cases, the lack of deep, liquid FX markets in Africa means these tools are either unavailable or prohibitively expensive, leaving importers as “price takers” in a hostile currency environment. The strong dollar’s impact extends to the very infrastructure of trade, as shipping lines and insurance providers almost exclusively price their services in U.S. dollars. Even if a business finds a cheaper supplier in Asia, the freight costs and marine insurance premiums must be paid in dollars, which have become more expensive in local terms. Additionally, many African governments calculate import duties based on the “Current Market Rate” of the dollar. As the dollar climbs, the tax burden on the importer rises automatically, even if the quantity of goods remains the same. This “tax on a tax” further inflates the final price of goods, ensuring that the consumer never sees the benefit of “cheaper” global prices. As we move into 2026, African business importers are shifting their strategies to survive the “Strong Dollar Era” by seeking alternatives to traditional trade routes. Many are exploring the Pan-African Payment and Settlement System (PAPSS) to trade in local currencies within the continent, reducing the need for dollar intermediation. Others are engaging in “near-shoring,” sourcing raw materials from neighboring countries rather than distant dollar-based markets. While the strong dollar continues to present a formidable challenge, these shifts in supply chain logic and the adoption of regional digital payment systems represent a critical evolution for African commerce, moving away from a total dependency on a single global reserve currency.
johneb492254456
 Beyond the unit price of goods, a strong dollar creates a severe cash-flow mismatch that threatens the survival of small and medium-sized enterprises. As the dollar strengthened through 2024, the amount of local currency required to fund the same volume of inventory nearly doubled in some markets. This forces business importers to divert funds from operations, marketing, and payroll just to maintain their stock levels. Many African businesses operate on credit lines denominated in local currency, which often hit their limits faster as exchange rates deteriorate. The result is a “liquidity trap” where businesses are technically profitable on a per-unit basis but are running out of cash because their working capital cannot keep pace with the dollar’s appreciation.

Sanctions as Strategy: When Finance Becomes a Weapon
January 21, 2026 by johneb492254456 Governments today increasingly rely on financial sanctions as a primary tool of foreign policy, turning access to banking systems, international payments, and global markets into levers of influence. Rather than deploying military force, major powers restrict liquidity, freeze assets, and isolate economies to pressure adversaries and enforce international norms. This approach has intensified in recent years, making financial infrastructure a central arena of geopolitical competition. The dominance of the U.S. dollar in global trade gives Western nations an outsized ability to enforce these measures worldwide. Financial sanctions have expanded dramatically over the past decade, shifting from broad trade embargoes to precise targeting of banks, oligarchs, and entire sectors. According to Castellum.AI’s annual reviews, the total number of active sanctions designations worldwide has risen sharply, driven by responses to conflicts and human rights concerns. While U.S. designations saw a 30 percent decline in 2025 amid shifting priorities, global regimes continued to grow, with notable surges in measures against Iran-related digital assets and ongoing restrictions on Russia. No country has faced sanctions on the scale seen against Russia since 2022, with consolidated trackers from Castellum.AI and the Atlantic Council showing tens of thousands of individual, corporate, and sectoral designations across U.S., EU, and allied lists. Iran, North Korea, Syria, and Cuba remain under long-standing comprehensive embargoes, while newer measures extend to networks supporting evasion. This web of restrictions now affects thousands of entities, reshaping global supply chains and forcing companies worldwide to screen counterparties constantly. Western allies responded to Russia’s invasion of Ukraine with the broadest and fastest sanctions package in history, targeting banks, energy exports, and technology imports. Russia’s economy initially contracted but later stabilized through wartime spending and redirected trade toward China, India, and Turkey. The IMF has progressively downgraded forecasts, projecting growth slowing to around 0.9 percent in 2025 and 0.8 percent in 2026. Longer-term analyses from Chatham House suggest Russia’s real GDP remains roughly 12 percent below pre-war projections. Sanctions inflict real costs, raising inflation, limiting technology access, and reducing long-term growth potential, but rarely achieve full policy objectives alone. Russia has adapted by building parallel trade networks and a “shadow fleet” of uninsured tankers to move oil despite price caps. Reports from Brookings and the Atlantic Council note that while Western measures have constrained Russia’s war financing, evasion through friendly jurisdictions has blunted the sharpest impacts. Unintended consequences include higher global energy prices and supply disruptions felt far beyond the targeted country. As sanctions proliferate, targeted nations accelerate efforts to reduce reliance on Western-controlled systems, expanding non-dollar trade settlements and alternative payment networks. Trends tracked by financial institutions show steady growth in renminbi, rupee, and other currencies for cross-border transactions. This shift risks dividing global finance into competing blocs, raising costs for everyone and embedding geopolitical risk into routine business decisions. In this environment, access to money and markets can vanish overnight based on political choices rather than economic fundamentals.
johneb492254456
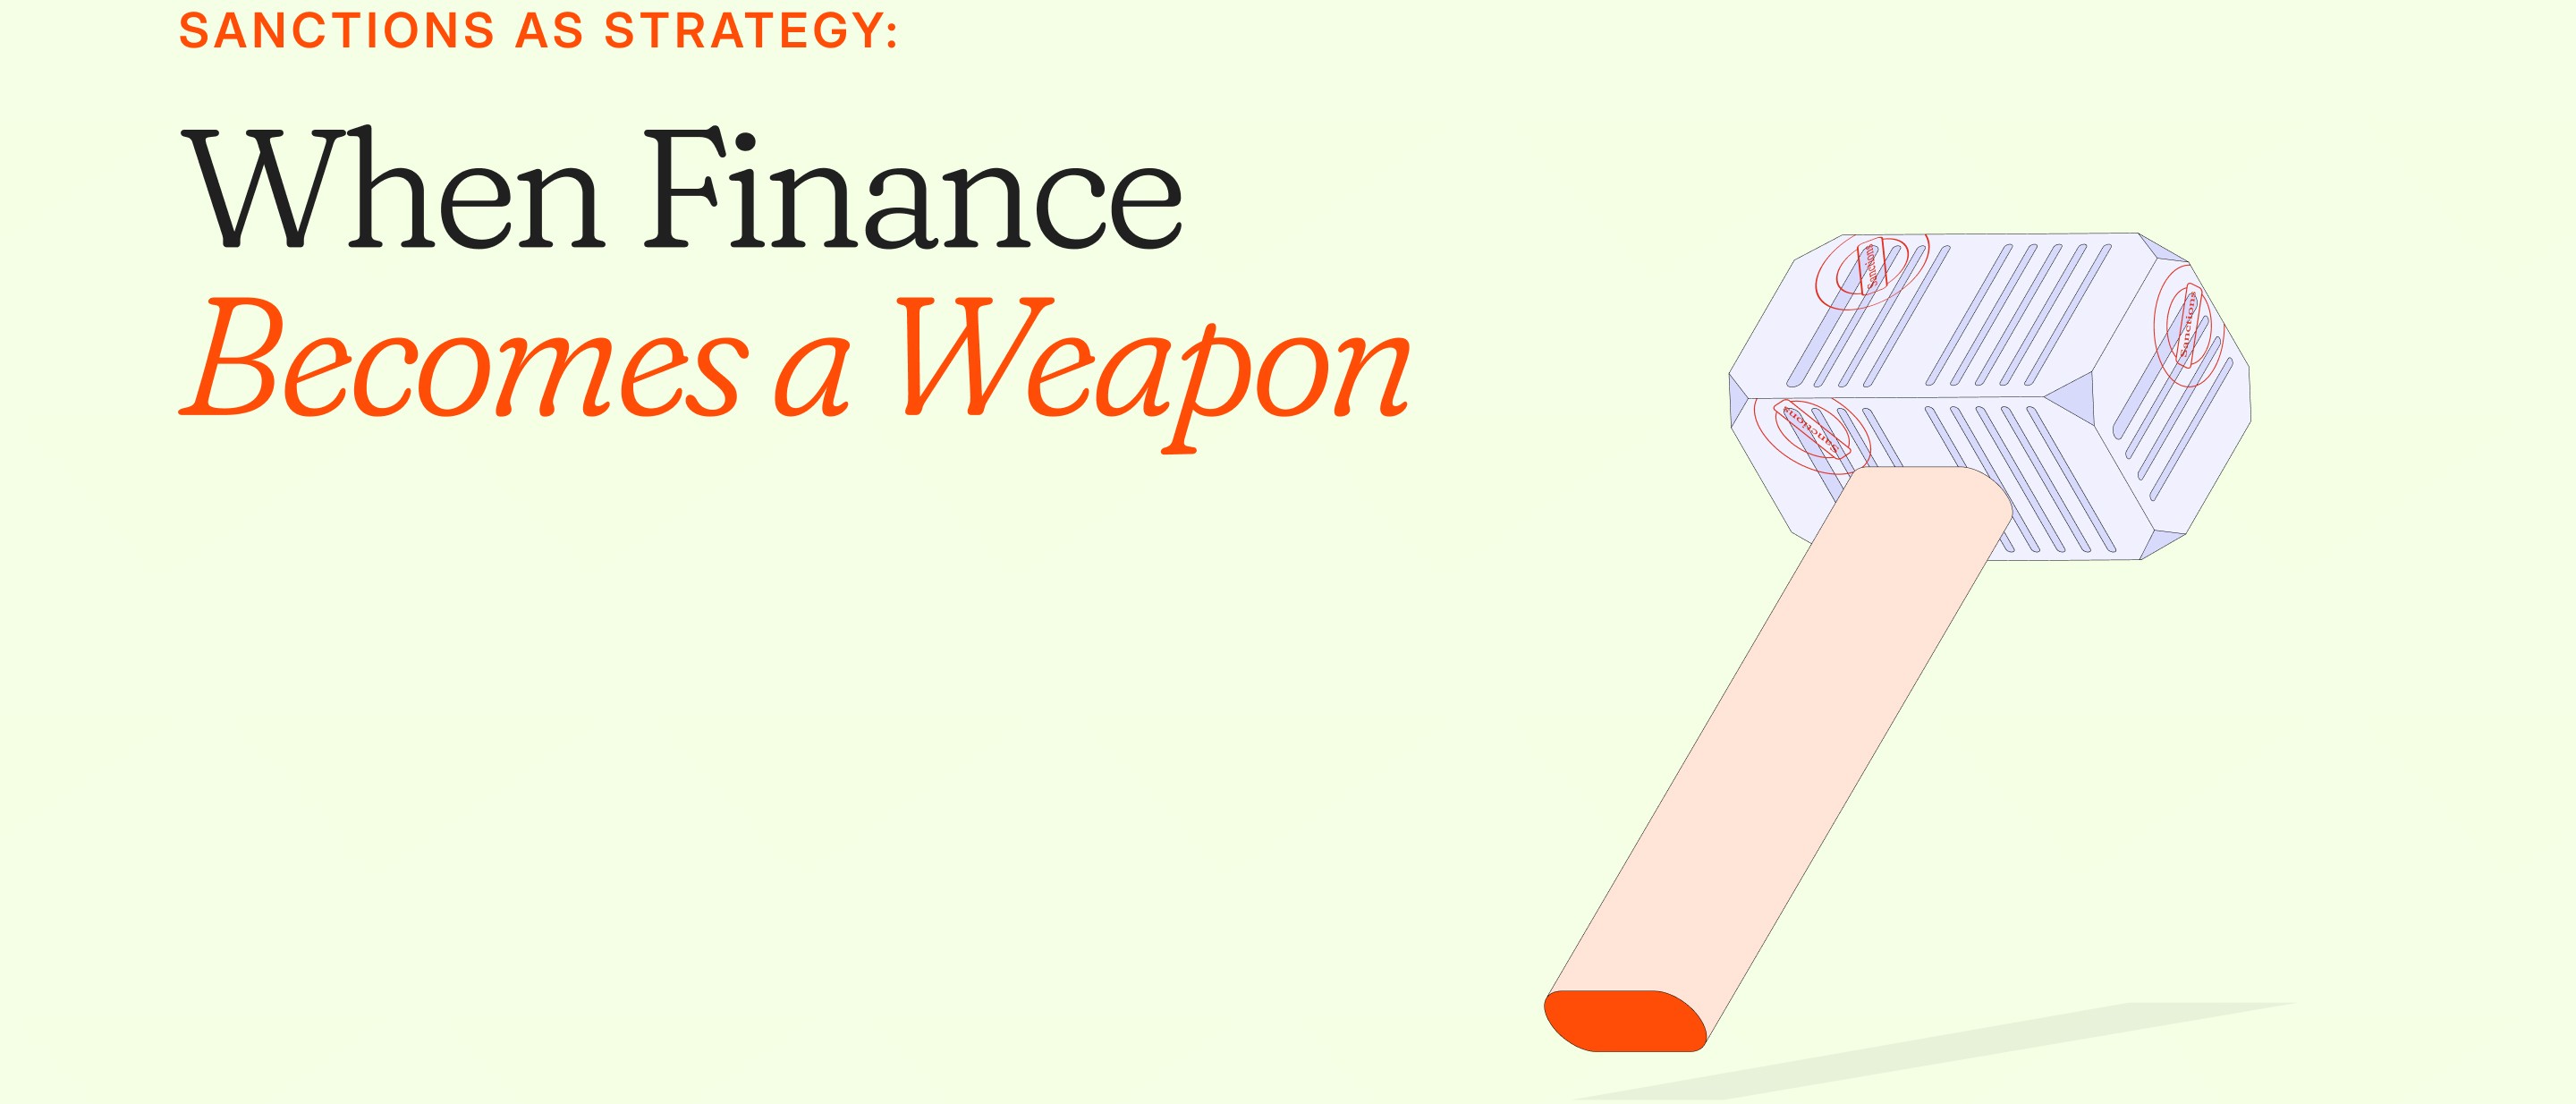
 Contemporary sanctions operate by disrupting access to critical financial plumbing. Key tactics include excluding institutions from the SWIFT international messaging system, freezing overseas reserves held in Western currencies, and applying secondary sanctions that penalize third-party companies for continuing trade with targeted entities. These steps create cascading effects: businesses lose insurance coverage, shipping routes dry up, and everyday transactions become impossible. The 2022 freezing of approximately $300 billion in Russian central bank assets illustrated how rapidly a major economy can face capital isolation.

Stablecoins at Scale: What $310B and Counting Means for Finance in 2026
January 14, 2026 by johneb492254456 In late 2025, the global supply of dollar‑pegged stablecoins surged past $310 billion. Far from a speculative bubble, this milestone reflects a structural shift: stablecoins are now the “digital cash” of crypto markets, driven by institutional demand and liquidity needs rather than everyday retail purchases. JPMorgan analysts forecast steady growth to around $500–$600 billion by 2028, underscoring that these tokens are becoming a core part of financial infrastructure. This presentation examines how a $310 billion stablecoin ecosystem is reshaping payments, DeFi, and traditional finance, highlighting data and expert insights from financial research and official sources. Stablecoin issuance has grown from essentially zero a few years ago to hundreds of billions today. Market data show aggregate stablecoin market cap jumping from roughly $5 billion in 2018 to about $310 billion by late 2025. That’s a tenfold increase over five years, with about 70% growth in the last year alone. The market remains highly concentrated: Tether (USDT) and Circle’s USD Coin (USDC) together account for a dominant share of that supply. In practical terms, stablecoins now represent a major liquid dollar pool on-chain. (Chart: Stablecoin market capitalization, 2018–2025, illustrating this rapid rise. In cryptocurrency markets, stablecoins function as the primary “cash” or base asset for trading. Exchanges quote most crypto pairs against USDT or USDC, making stablecoins roughly 80% of total trading volume. Crypto investors typically hold stablecoins as cash‑equivalents (a way to park value between volatile positions). In decentralized finance (DeFi), stablecoins are central: more than half of all DeFi collateral (total value locked) is denominated in stablecoins. Major DeFi lending and liquidity protocols are built around these tokens because their stable value and liquidity make capital markets programmable without price volatility. Engineers are even developing yield‑bearing stablecoins that automatically earn interest, turning idle currency into productive capital. Stablecoins promise a revolution in cross‑border payments. They can settle transfers almost instantly around the clock and at a fraction of traditional cost. The IMF notes that using blockchains and stablecoins can collapse multi‑day remittance processes into minute‑long, low‑fee transactions. Empirical data show stablecoin transaction flows soaring past those of Bitcoin or Ethereum (see chart): stablecoin volumes have been growing much faster, reflecting their use for international settlements. This technology bypasses multiple banking intermediaries and costly legacy rails (SWIFT, correspondent banking), dramatically lowering friction and fees. Major firms and banks are piloting stablecoin rails for payments and remittances, and some remittance providers report cost cuts of up to 90% by switching to stablecoins. Widespread stablecoin use will have broad macroeconomic effects. The IMF warns that if people in high‑inflation or underbanked countries adopt stablecoins en masse, it could lead to currency substitution (dollarization) and constrain central bank policy. For instance, some emerging markets face the risk that remittances in stablecoins flow out of domestic banking, weakening local currencies and forcing tighter monetary policy. Similarly, stablecoins could enable individuals and firms to circumvent capital controls, altering global capital flow patterns. In response, international regulators have started treating large stablecoin issuers like payment utilities rather than free crypto projects. The IMF/FSB emphasizes the need for clear rules, robust reserves, and oversight to prevent runs or illicit use. What was once fringe is now mainstream for institutions. Surveys in 2025 found that nearly half of surveyed financial firms were already using stablecoins in production, with another 40% or so piloting them. The leading use cases are corporate and cross‑border payments: an Ernst & Young survey reported 62% of companies using stablecoins for supplier payments and 53% for other business expenses. Institutional treasuries view stablecoins as operational tools for liquidity management. Unlike traditional bank payments (limited by hours, exchanges, FX risk), stablecoins are 24/7 and avoid needing correspondent banking. As one analyst puts it, companies treat stablecoins like “digital dollars” that move instantly with full visibility. In response, major payments and fintech players are building stablecoin infrastructure: for example, Stripe acquired a stablecoin startup, and Visa/Mastercard are exploring crypto‑linked rails. Meanwhile banks and asset managers are integrating stablecoins: JPMorgan’s research notes institutions deploying tokenized deposits and launching blockchain‑based funds that settle in stablecoins. These moves show stablecoins evolving from speculative tokens to elements of core financial infrastructure.
johneb492254456

January: The Real Start of the Trade Year — Why December Data Misleads
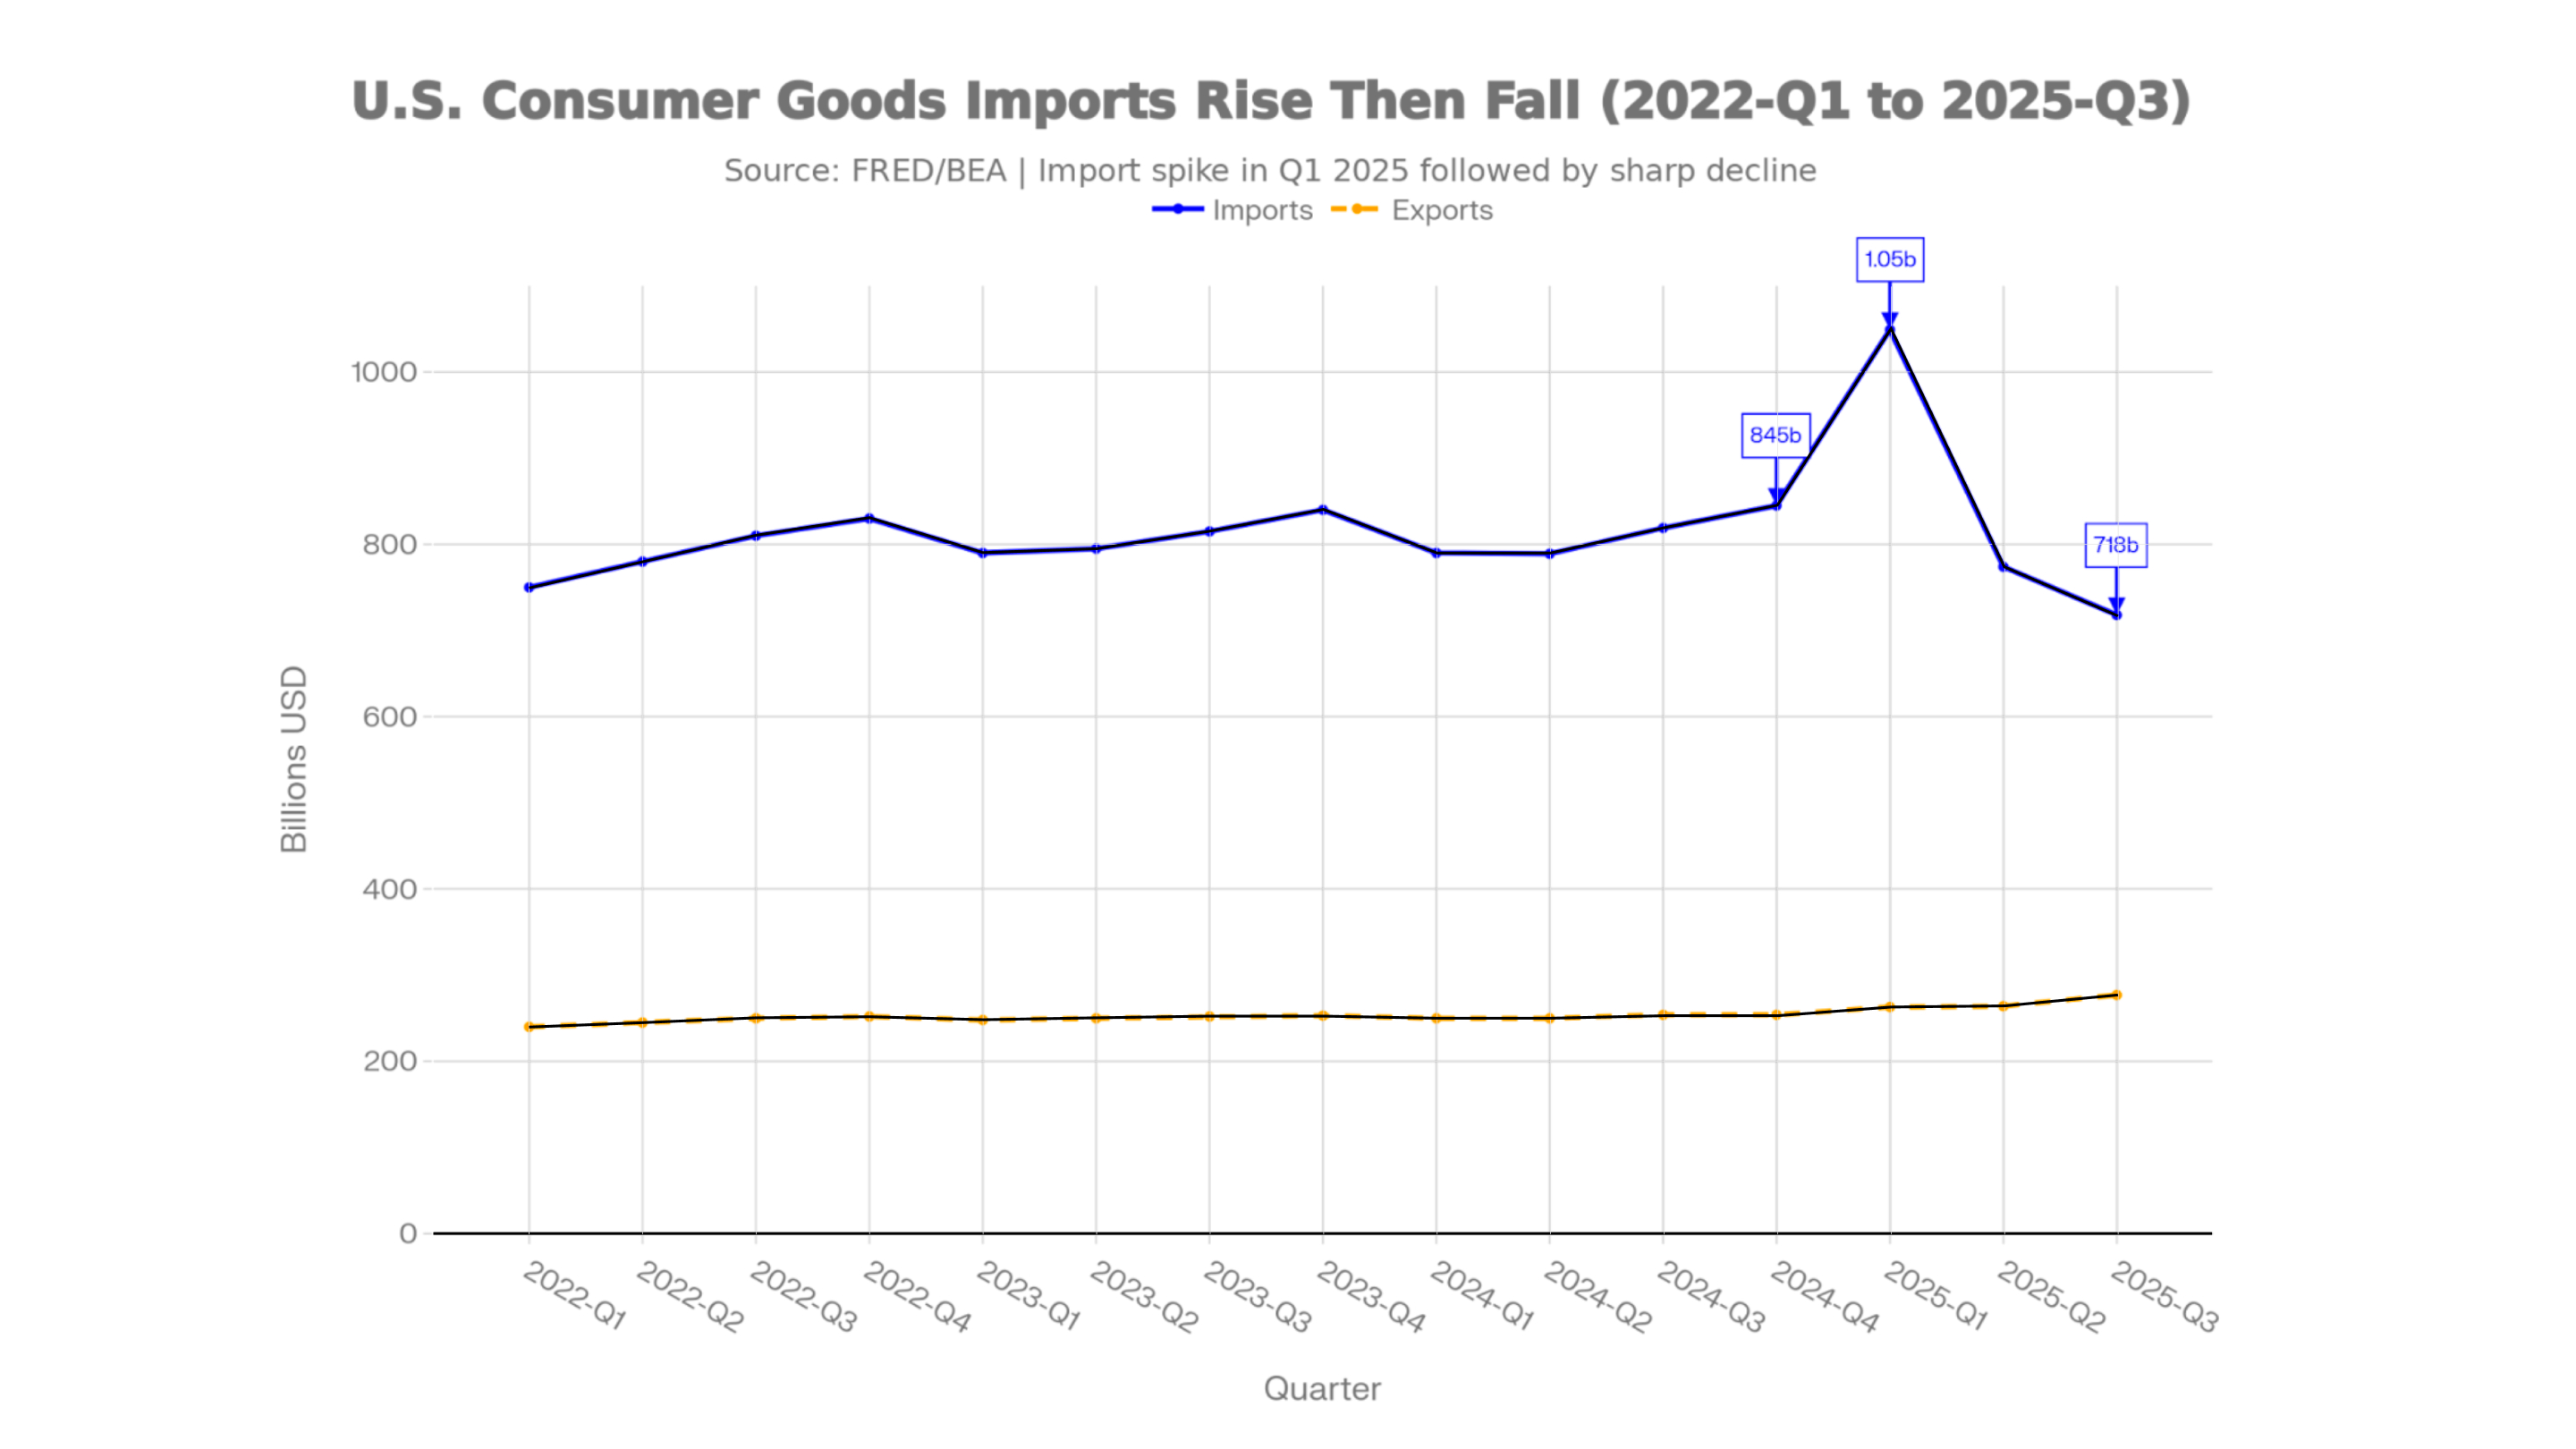
January 7, 2026 by johneb492254456 Data released in January often upends the exuberance of December. Economists caution that calendar effects distort year‐end trade figures. As Brad Setser notes, the “pre-holiday surge in imports” in the U.S. and Europe shifts ever closer to Christmas, making it difficult to determine whether December’s strength is genuine demand or simply a seasonal pull-forward. In practice, companies often flood markets in Q4 to meet contracts and clear budgets, not because final demand increased. The result is a misleading spike in December numbers. Multiple sources confirm that once the holiday “noise” fades, January data show the true baseline of trade activity. December trade volumes jump for several non‐economic reasons. Retailers heavily promote goods for the holidays and rush to clear annual budgets or take advantage of tariff windows. For example, retailers “took steps like front-loading imports” in Q4 while tariff increases were delayed. Supply‐chain experts observe that store shelves were kept “well‐stocked” by such front‐loading. Paradoxically, this means December volumes fall afterward – data from the NRF’s Global Port Tracker foresaw an almost 18% year‐over‐year slump in December import volumes (the weakest since March 2023) because firms had pulled shipments forward. In effect, December can look like “growth” when much of it is a timing shuffle – budgets had to be spent and contracts met at year’s end, regardless of true demand. When the new year begins, these artificial boosts unwind. Importers that raced in December often pause in January as cash constraints, credit limits, and inventory realities set in. Logistics surveys show this shift. The January 2025 Logistics Managers Index, for instance, noted its fastest overall expansion in three years, driven largely by inventory buildup under tariff uncertainty. At the same time, truck freight volumes did not rebound with import dollar totals. FTR’s index for January 2025 plunged to –2.56 (vs +2.67 in Dec), reflecting weak freight volumes and utilization even as high-value goods arrived. In short, January data expose the “reality” behind the season: inflated demand signals collapse into genuine demand – often revealing that actual shipments and freight usage have slowed. In the U.S., the consumer goods sector illustrates the December/January shift. The data show that imports of consumer goods (excl. food/auto) jumped from about $818.7 billion in Q3’2024 to $845.2 billion in Q4’2024, then collapsed to $717.9 billion in Q3’2025. Exports of consumer goods by contrast stayed around $250 billion per quarter, underscoring that the Q4 import spike was not matched by an export or demand increase abroad. In fact, January 2025 imports (SAAR) surged to an even higher $1,048.9 billion – largely because shippers advanced orders into year‐end, not due to new demand. In sum, January often marks the true start of the trade year. December data can be an illusion, inflated by seasonal and fiscal factors. As multiple sources underline, year‐end trade figures should not be overinterpreted. When the holiday “noise” passes, January’s figures tend to reflect underlying consumption power and supply‐chain capacity. Businesses and analysts, therefore, look to January (and often March) to reset expectations. Citations from trade analysts and statistical agencies alike urge this perspective: only after the New Year’s transitional distortions do actual demand and inventory levels become clear, setting a reliable baseline for the year ahead.
johneb492254456
 This December/January pattern is not unique to the U.S. Other economies show similar swings. Official German trade data, for example, swung markedly: January 2024 exports jumped 6.3% (and imports +3.6%) vs. Dec 2023, but by January 2025, exports were down 2.5% from Dec 2024. These month‐to‐month reversals reflect volatility around year‐end. China’s recent data also underscore the effect of single-period anomalies: in November 2025, China’s total exports actually fell 1.1% year-on-year, but shipments to the U.S. plunged over 25%, driven by year-end tariff moves. In short, spikes or dips at year‐end can obscure longer‐term trends in any country’s trade.