


The 2030 Factory Floor: Data, Not Dust
October 29, 2025 by johneb492254456 The next decade will see factory floors become data engines rather than just assembly lines. Advanced factories will “no longer [be] just sites of production” but rather “intelligent ecosystems” where connected machines and AI constantly communicate. Manufacturers are already treating this shift as critical: by 2019, roughly 68% of companies said Industry 4.0 (the digitization of manufacturing) was a top strategic priority, with 70% already piloting new smart technologies. In short, the “dust” of old machinery is giving way to a new era where every robot arm, sensor and meter on the shop floor generates streams of data. This data – ranging from vibration logs to energy use – will be continuously fed into analytics engines and AI models, transforming raw numbers into insights. Modern factories rely on a convergence of technologies to capture and act on data. The Internet of Things (IoT) is now ubiquitous on the shop floor: low-cost sensors and RFID tags can monitor machines, inventory and environment in real time. Indeed, the total number of IoT-connected devices worldwide is expected to jump from about 9.7 billion in 2020 to over 29 billion by 2030. These devices feed data into cloud platforms and edge-computing nodes, where AI and machine learning turn the torrents of sensor readings into actionable patterns. In the language of Industry 4.0, manufacturing is being “powered by data, connectivity, and advanced analytics”. As factories churn out ever more data, the real advantage comes from analyzing that data. Manufacturers report that data volumes are already surging: in one survey, nearly half of respondents said the amount of data they collect has doubled in just two years and will triple by 2030. Crucially, firms are moving beyond record-keeping to predictive analytics. For instance, predictive maintenance uses IoT sensors and AI to flag equipment issues before failure. Analysts project this market will explode from roughly $7.9 billion in 2022 to over $60 billion by 2030, reflecting how valuable uptime has become. The payoff from data-centric factories is significant productivity and cost improvements. By continually mining sensor data, factories can squeeze out waste, reduce defects, and run leaner. For example, AI-driven scheduling can balance workloads across shifts, while real-time dashboards let managers spot bottlenecks as they emerge. This has economic impact: one analysis finds companies using smart-factory technology cut downtime and boost output substantially. Survey data bear this out: 86% of manufacturing leaders believe that effective use of data will be “essential” for competitiveness in the coming years. In monetary terms, analysts project enormous growth in smart-manufacturing sectors – from industrial robotics to digital twins – as factories invest in data capabilities. Factories will also monetize data through services (like selling digital twin simulations or performance warranties). By 2030 the most valuable output of a factory may be its data streams rather than just widgets. Leading economies recognize this. For instance, Germany’s digital economy (which includes smart manufacturing) is already worth around $250 billion in 2024 and growing. National plans like Europe’s Industrie 4.0 platform and China’s smart manufacturing initiatives explicitly treat data as a resource. Germany even emphasizes “digital sovereignty” – aiming to control domestic data flows and reduce reliance on foreign tech.. Practically, this means factories will sell more than cars or chips: they will offer continuous data-driven services. As we look toward 2030, several themes emerge. Factories will resemble data centers as much as workshops. Success will require new skills: companies must invest heavily in upskilling and cybersecurity as manual tasks give way to data analysis and software control. Policies will need to adapt too, with standards for data sharing, privacy, and cross-border flows. Investors and managers should note the opportunity: according to a Bloomberg analysis, in manufacturing “data is the new currency”. In summary, the competitive edge of tomorrow’s manufacturing economy will rest on who can collect, interpret and capitalize on factory data most effectively. The dusty assembly line is being swept away by a wave of data-driven efficiency and innovation – and those who seize this digital gold rush will lead the industries of the future.
johneb492254456

 In practice, a failing motor might automatically trigger an alert and schedule a technician before any breakdown occurs. Meanwhile, factories increasingly use AI models to predict quality issues or optimize energy use in real time. Notably, 95% of manufacturers say using data in this way leads to faster and higher-quality decision-making. In other words, data flows will underpin nearly every production decision by 2030.

Why Ghana’s Food Import Bill Keeps Shrinking — and What That Means for Local Agriculture
October 20, 2025 by johneb492254456 Over the past five years, Ghana has consistently spent on the order of $2–3 billion annually to import food and agricultural products. For example, USDA-reported data show Ghana’s food and farm imports were about US$2.68 billion in 2023, rising to roughly $3.25 billion in 2024 (one government source quotes an annual bill of about $2 billion). These figures imply Ghana still sources roughly half its staples from abroad. (Notably, domestic currency inflation and exchange-rate shifts have made the cedi values even higher.) Despite the headline numbers staying large, some observers have noted that the import bill’s growth may be slowing – it “hovered at $2 billion in 2024, a figure that has remained stubbornly high for the past five years”. In other words, growth in import spending appears to have moderated. This report examines why the import bill has not risen even faster (and even shows signs of leveling off) by analyzing both economic forces and government policies. A major driver has been Ghana’s macroeconomic turmoil since 2022. The cedi lost more than 50% of its value in 2022, and inflation surged – at one point, consumer inflation was above 40%. When the local currency plunges, the cost of imports soars. Many Ghanaian importers found it hard to raise enough foreign exchange to pay for food shipments. Indeed, in late 2022 the Bank of Ghana imposed foreign-exchange controls on staples (notably rice, poultry, vegetable oil, and other basic foods). This effectively reduced import volumes: goods like rice and chicken became scarce and more expensive. Simultaneously, rapid inflation squeezed consumer budgets and cut demand for higher-priced imported foods. Analysts note that with inflation eroding purchasing power, many Ghanaian households began cutting back on “luxury” food purchases – even if prices hadn’t jumped, basic necessities ate up more of their income. In short, depreciation and high inflation made food imports more costly and less affordable, slowing their growth. (By mid-2025, inflation had eased to ~12%, aided by a modest cedi recovery, but the 2022–23 shock was already felt in lower import volumes.) Global shocks – for exampl,e surges in world grain and fuel prices – also meant Ghana paid more per unit when it did import, further limiting the quantities it could afford. Ghana’s authorities have simultaneously launched aggressive programs to boost domestic production of key foods. The flagship “Planting for Food and Jobs” (PFJ) program, begun in 2017, supplied subsidized seeds, fertilizers and machinery to farmers. PFJ dramatically raised yields – for instance, maize yields jumped ~67% and rice ~48% per hectare in 2017 – and expanded acreage. By 2019, PFJ inputs had generated on the order of 1.2 million extra tons of cereal and legume output. Such gains mean more staple grain is grown locally instead of bought abroad. Under the COVID-era Ghana CARES economic plan and related schemes, the government explicitly targeted import substitution in crops like rice, poultry, soya, cassava, tomatoes and sugar. For example, affordable financing and support were offered to rice millers, poultry hatcheries, and other enterprises to expand local supply. In April 2025 the administration launched the new “Feed Ghana” program, part of an Agriculture-for-Transformation agenda. President Mahama noted the “staggering $2 billion” food import bill and promised a push on smart farming, mechanization, and value chains. Feed Ghana prioritizes maize, rice, poultry, and other import-intensive commodities, and includes initiatives like farmer service centers (providing equipment and training), urban vegetable gardens, and a nationwide poultry project (“Nkoko Nketenkete”) to ramp up chicken production. (Mahama’s government has also signaled import “bans” or tariffs on certain foods like foreign-grown pork, and has supported projects to produce feed and fish locally.) These policy changes – from subsidized inputs to import controls – are designed to slow the growth of the import bill by raising Ghana’s own output. Notably, in mid-2023, Ghana even temporarily banned imports of some poultry products and feeds on sanitary grounds (H5N1 avian influenza), which had the side-effect of immediately shrinking poultry import volumes. A lower food import bill would give Ghana’s farmers and agribusinesses a bigger share of the domestic market. Opportunities include: more stable demand for local cereals, meat, and vegetables; new jobs in agro-processing; and increased foreign exchange retention. For example, the government’s push into domestic poultry (e.g., a new 100,000-bird training farm) aims to meet nearly all national chicken demand locally within a few years. If Ghana’s farmers can continue raising yields and output (through the above programs), that could reduce waste (nearly 30% of grains and 50% of fruits/vegetables are lost today) and turn lost surplus into real supply for consumers. Many analysts argue that mobilizing this latent production (worth about $1.9–2.0 billion a year) could effectively feed hundreds of millions of Ghanaians without imports. In broad terms, a shrinking import bill would mean stronger food self-sufficiency: Ghana would be less exposed to global price swings, and its agriculture could become a driver of growth rather than a drain on foreign reserves. However, several challenges could slow this transition. Local farmers still struggle with high input costs, limited irrigation, and erratic weather. For instance, a 2024 drought cut Ghana’s maize harvest by nearly 30%, forcing a spike in imports despite high prices. Without continued investment, productivity gains may plateau. Ghana’s food systems also lack adequate storage, processing and logistics – the very bottlenecks that cause massive post-harvest losses. In practice, some staples like wheat have no domestic substitute, and meat/vegetable consumption remains high even as incomes stagnate. Policymakers must also ensure that reducing imports does not trigger shortages or inflation; indeed, experts warn that overdependence on imports has driven food-price inflation in Ghana, and cutting off imports too fast could keep prices high if local supply cannot ramp up. In summary, Ghana’s food import bill remains very large but its rise has been tempered by both economic headwinds (currency collapse, forex limits and inflation) and deliberate policies to grow local output. The trend reflects a tug-of-war: on one side, falling import volumes from tighter markets and policy controls; on the other side, growing food demand and remaining yield gaps. For local agriculture, a declining import bill signals a big chance (bigger home market and investment) but also warns of challenges (meeting that demand reliably). With the right support, Ghana aims to turn those challenges into opportunities – so that more of the country’s food is grown and processed at home.
johneb492254456

Ghana’s Shrinking Food Import Bill (2020–2025)
 Economic factors
Government programs and trade policies
Implications for local agriculture (opportunities and challenges)

The Container is Mightier Than the Currency: How Freight Costs Dictate Inflation
October 15, 2025 by johneb492254456 For decades, policymakers focused on money supply and interest rates to control inflation. Recent years have shown that global shipping costs can powerfully amplify price pressures. More than 80% of world trade travels by sea, and pandemic-era disruptions led to unprecedented container bottlenecks. When ports clog and freight rates surge, input costs jump long before central banks can respond. In early 2021, for example, the price to ship a 40-foot container from Shanghai to Rotterdam rose from about $2,000 to over $14,000 – a more than seven-fold increase. This staggering spike in maritime freight transformed a logistics headache into an inflationary shock. As one IMF analysis noted, when container shipping costs double, inflation globally tends to rise by roughly 0.7 percentage point. The lesson is clear: controlling prices now means understanding ships and ports, not just printing presses. Economic data show a close link between freight rates and prices. For instance, a composite global shipping cost index (covering major routes) closely tracked U.S. import price inflation in recent years. Both measures jumped in 2020 and again in late 2023. Studies confirm the correlation: the Boston Fed finds that import prices surged in lockstep with freight-cost jumps, and IMF research finds that the pass-through from shipping costs into consumer prices can take about a year to fully emerge. In practical terms, this means supply-chain snarls (like port congestion or rerouting around blockages) show up as higher prices for consumers and producers well after the fact. Shipping cost shocks propagate through the economy in stages. First, import prices at the dock jump within a couple of months of a freight hike. Then producers who rely on those imports raise their prices. Finally, higher consumer prices build slowly, peaking roughly a year after the initial shipping shock. Empirical work by the Boston Fed confirms this pass-through: routes with higher cost increases saw faster import price growth than cheaper routes for the same goods. In other words, businesses eventually pay the freight, and consumers pay the businesses. Moreover, the impact is especially large in countries that import a lot of what they consume. The IMF finds that shipping surges drive up headline inflation more in economies with large import shares. Landlocked or small-island nations, where freight makes up a big chunk of input costs, have felt the pinch most acutely. In 2023–24, for example, disruptions (Panama Canal drought, Red Sea attacks) pushed freight indices roughly back toward their pandemic peaks, implying cumulative import-price inflation on the order of a quarter of a percentage point per month. Models from analysts like Fitch Ratings show that a 150% jump in shipping costs from Red Sea turmoil could eventually add about 0.4–0.5 percentage point to core consumer inflation Maritime chokepoints have become critical inflation nodes. In late 2023, Houthi rebel attacks in the Red Sea forced carriers to avoid the Suez Canal. Shipping costs there shot up over 150%, and Fitch warned this alone could add roughly 0.5 percentage point to U.S. core inflation over time. Similarly, a severe drought in Panama (spring 2023) has restricted canal traffic, forcing many ships to take much longer routes around South America. These detours intensify congestion elsewhere and raise freight charges globally. The net effect is that geopolitical and climate shocks now feed straight into prices. Higher transport costs ripple through supply chains – for example, squeezing factory margins or driving up retail import bills – long before central bankers can adjust rates. Today’s freight-market outlook is mixed. Spot rates have cooled from the 2021 highs (Drewry’s container index was near $1,650 in October 2025, the lowest since early 2024), but vulnerability remains. Shipping alliances and carrier strategies also matter. For example, lines jointly agreed to halt Red Sea transits in 2024, which pushed up Cape routes and costs. The composition of liner alliances (which set vessel capacity and routes) can subtly influence pricing and resilience to disruptions. Climate change adds another layer: worsening El Niño conditions made Panama drier, reducing canal throughput and raising freight costs. In this new landscape, whoever controls the “road” of global trade – from canal authorities to coalition agreements – can sway inflationary pressures. Inflation is increasingly shaped by freight costs, not just monetary policy. Control over shipping routes and logistics now rivals control over money supply in determining economic stability. For emerging markets, true resilience means investing in regional ports and supply chains to reduce exposure to global freight shocks. Central banks can adjust rates, but they can’t move containers; meaning inflation forecasting must evolve to include logistics data like vessel traffic and port congestion. In today’s world, the container has become a stronger signal of inflation than the currency itself.
johneb492254456


How AfCFTA Payment Systems Are Chipping Away at Dollar Dependence
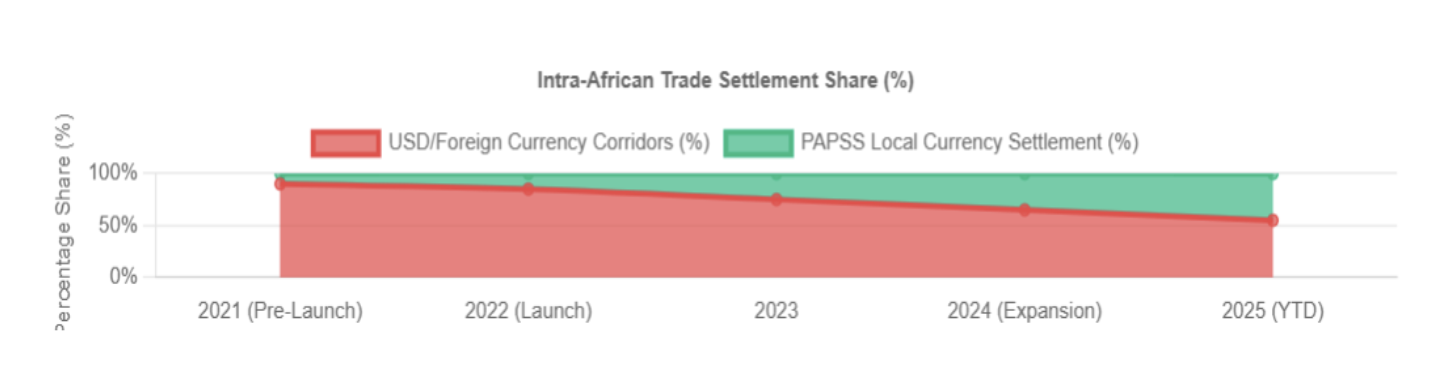
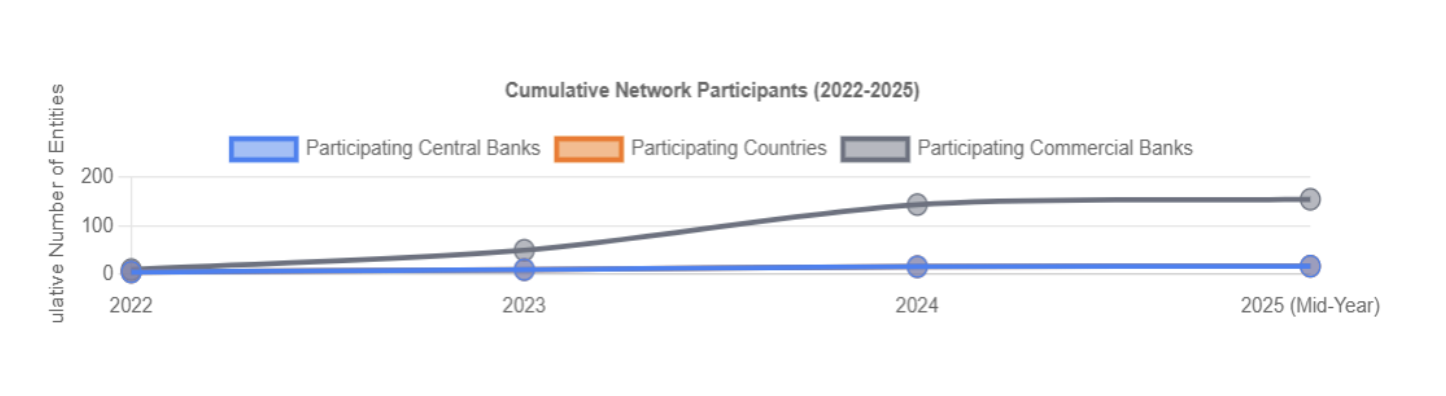
October 14, 2025 by johneb492254456 The African Continental Free Trade Area (AfCFTA) aims for a single continental market, but its success depends on seamless cross-border payments. To that end, Afreximbank and the African Union launched PAPSS in January 2022 as a centralized RTGS platform for local-currency settlements. PAPSS is designed to let African businesses pay each other in their own legal tenders (for example, Egyptian pounds to Kenyan shillings) in near–real time, bypassing USD intermediaries. In the words of PAPSS’s CEO, this infrastructure keeps payment flows inside Africa (avoiding expensive routes via New York or London) and unlocks a $3.4 trillion intra-African market. PAPSS operates as an RTGS payment infrastructure connecting African central and commercial banks. According to its official description, it “enables the efficient flow of money securely across African borders” by collaborating with central banks and payment service providers. Key features include: These processes transform what used to take days or involve multiple currencies into a single-step transfer. For example, when PAPSS launched in Comoros (Aug 2024), its central bank highlighted that payments between Comoros and any other African country could now be completed in ~120 seconds in Comorian francs, without first converting to a foreign currency. By settling in local legal tenders, PAPSS drastically cuts costs and time compared to legacy U.S.-dollar corridors. Internal estimates suggest a $200 million cross-border payment could incur 10–30% in fees under the dollar-based system, whereas using PAPSS in local currencies cuts it to about 1%. Africa could therefore retain an estimated $5 billion annually that would otherwise leak out in foreign exchange fees. Crucially, PAPSS keeps funds on the continent. Before PAPSS, “over 80% of our trade payments” had to route through New York/London bank networks. Now those funds can remain within African banking systems. PAPSS usage has ramped up significantly. January 2024: Banque Centrale de Tunisie became PAPSS’s first North African member (the 13th overall country) under a new “commercial bank settlement” model. Tunisian officials immediately touted using dinars for intra-African trade to preserve foreign reserves. August 2024: The Central Bank of Comoros joined PAPSS; its launch announcement noted Comorians can now make continent-wide payments “directly in Comorian francs” in ~120 seconds. By late 2024, PAPSS had officially onboarded 16 central banks and 144 commercial banks. That year also saw the successful pilot of the PAPSS African Currency Marketplace, which settled transactions in 12 different African currencies. All told, 15+ countries – from West, East, and Southern Africa – will be live by the end of 2024. 2025 (YTD): Adoption has accelerated. By mid-2025, PAPSS connected about 17 African countries and 150+ banks. To boost usage, several member governments have taken new measures. For example, Nigeria’s central bank (April 2025) dramatically streamlined KYC/AML paperwork for PAPSS payments (requiring only basic documents on individual transfers ≤$2,000 and corporate transfers ≤$5,000). This policy explicitly aims to make PAPSS “faster, more cost-effective and more inclusive” for Nigerian businesses under AfCFTA. Also in 2025, PAPSS introduced its African Currency Marketplace commercially (announced July 2025 at the Afreximbank Annual Meeting), enabling a transparent order-book for African FX swaps. Despite progress, significant hurdles remain to full PAPSS integration and broad adoption: Together, these barriers underscore why PAPSS adoption has been “patchy and uneven”. Analysts project that without phased FX liberalization, harmonized KYC rules, and a pan-African fintech passport regime, AfCFTA’s digital trade goals may not be fully achieved. PAPSS’s rise has distinct effects on different stakeholders: Recognizing these challenges, stakeholders are pursuing multiple strategies: PAPSS represents a bold step toward African financial sovereignty. By wiring together 1.3 billion people with a common payments infrastructure, it tackles the continent’s legacy of dollar-based trade and correspondent-banking bottlenecks. Recent data show that PAPSS is gaining critical mass: tens of central banks and well over 150 commercial banks are now connected. Its innovations – like the African Currency Marketplace – directly address continent-wide pain points of convertibility and liquidity.
johneb492254456

Mechanics and Processes
Local-Currency Settlements and Dollar Bypass
2024–2025 Developments and Expansion
Barriers to True FX Integration
Implications for Central Banks, Commercial Banks, and SMEs
Strategic Efforts to Boost Usage and Interoperability
Country Case Studies and Adoption Insights
Conclusion
How Africa-Asia Trade Corridors Are Quietly Redefining Global South Commerce
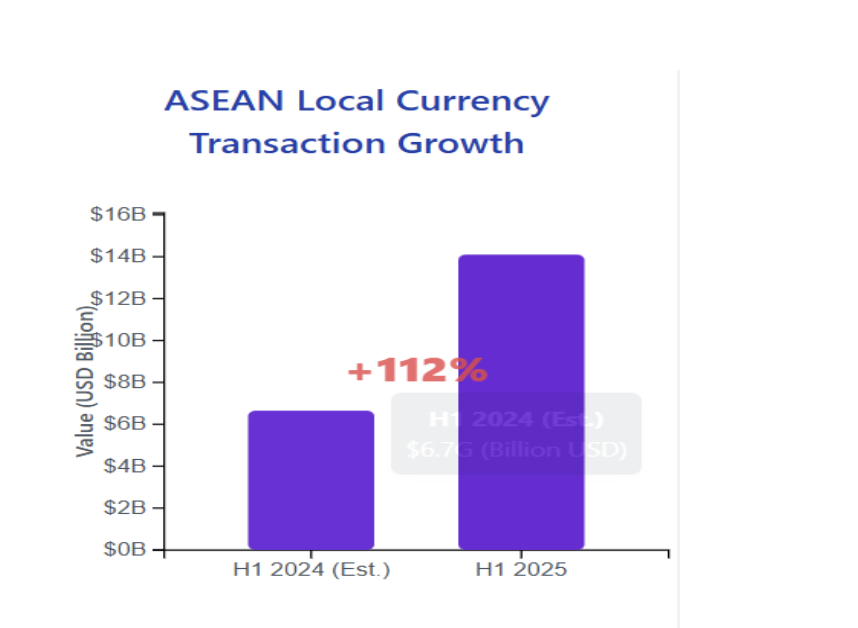
October 14, 2025 by johneb492254456 Trade between Africa and Asia has surged in recent years, creating new South–South corridors that bypass traditional Western financial channels. In 2024, Asia–Africa trade is likely to exceed $400 billion (with China–Africa alone ~$296 billion). Major infrastructure projects (ports, railways, pipelines) and bilateral agreements are knitting Asian and African markets closer. Crucially, Chinese, Indian, and Southeast Asian investors increasingly settle trade in local currencies, reducing reliance on the US dollar and SWIFT. This shift – quietly championed by leaders from ASEAN to BRICS – is reshaping global trade patterns in the Global South. China is systematically pushing its yuan into Africa to support Belt & Road corridors. In 2025 alone, Chinese banks and African financial institutions signed multiple yuan-denominated trade agreements. For example, during Premier Li Qiang’s visit to Egypt, China and Egypt agreed on a yuan–dinar swap and expanded UnionPay and CIPS (China’s SWIFT-alternative) payment links for the Suez trade zone. Other African countries – notably South Africa, Nigeria and Angola – have struck yuan-settlement deals with Beijing. These accords allow exporters and importers to invoice directly in RMB, bypassing dollar credit lines. The infrastructure for moving yuan is expanding: China’s Cross-border Interbank Payment System (CIPS), launched in 2015, now connects Chinese banks to their global counterparts. In mid-2025, two African institutions – Afreximbank and South Africa’s Standard Bank – joined CIPS as direct members. This allows them to clear yuan payments without an intermediary (and without routing them through Western SWIFT channels). Beijing has made dozens of currency-swap lines and payment pilots with African central banks. In short, Chinese projects on the continent are increasingly financed and repaid in yuan, reinforcing Asia–Africa corridors outside US/EU banking. India is likewise encouraging local-currency trade with Africa. New Delhi has struck deals to settle more of its exports in rupees. In July 2023, India and Malaysia agreed that bilateral trade could be invoiced in INR. India is also negotiating rupee settlement pacts with key suppliers (like Saudi Arabia and the UAE) and has a longstanding rupee-for-ruble mechanism with Russia. To facilitate this, many foreign banks now hold Rupee accounts in India. By late 2024, 18 countries – including Kenya, Tanzania, and Mauritius – had banks with special Vostro Rupee accounts in Indian banks. This infrastructure lets an African importer receive rupees directly and swap them locally, skipping dollar funding. Indian businesses on the continent welcome this trend. Trade between India and Africa recently topped $100 billion (nearly double from 2019), yet exporters often face costly currency hedging or credit constraints. As one analyst notes, “promoting Rupee-denominated trade could alleviate local liquidity issues, stabilizing costs for African importers and encouraging deeper integration”. In practice, this means a Kenyan firm importing Indian machinery might pay in rupees (via a correspondent bank) instead of sourcing scarce dollars – effectively bypassing Western banks and dollar exchange markets. Southeast Asian economies have also built local-currency payment networks, which indirectly strengthen Asia–Africa links. Since 2016, Thailand and Malaysia have operated a Local Currency Settlement Framework allowing firms to settle trade in baht or ringgit. Indonesia joined the scheme in 2018, and new QR-code payment arrangements now let people pay cross-border in baht, ringgit, rupiah or other ASEAN currencies without any dollar intermediary. These regional platforms have taken off: in the first half of 2025, ASEAN cross-border transactions in local currencies hit $14.1 billion (a 112% jump year-on-year). Officials credit the shift with making trade and investment more efficient and reducing FX volatility in Southeast Asia. Although ASEAN’s schemes mainly cover intra-ASEAN trade, they set a precedent that ASEAN-led investors bring to Africa. For example, Singaporean agribusinesses (like Olam and Tolaram) are major players in Africa, and Thailand’s investors (like Charoen Pokphand) operate widely. These firms, aware of their own region’s LCSF, increasingly favor using baht, ringgit or rupiah in their African deals when possible, mirroring what they do at home. At the 2025 BRICS summit, Malaysian PM Anwar Ibrahim explicitly cited ASEAN’s local-currency model as one to emulate, urging emerging markets to challenge Western dominance by trading more in national currencies. Beyond specific deals, several new payment systems underpin these corridors. China’s UnionPay network has expanded across Africa, and its Cross-Border Interbank Payment System (CIPS) is being pitched as an alternative to SWIFT for RMB payments. Africa’s Standard Bank and Afreximbank joining CIPS means African exporters can receive yuan settlements without US or EU correspondent banks. Similarly, India’s growing use of Special Rupee Vostros allows trade flows to settle via UPI or other domestic rails in Asia. Looking ahead, multilateral projects could further cement local-currency corridors. For instance, ASEAN central banks launched a multilateral QR-payments system linking Indonesia, Malaysia, Singapore, and Thailand. BRICS countries (which now include major African economies like Egypt and Ethiopia) are developing their own payment platform (“BRICS Pay”) for cross-border local-currency transfers. Combined with regional swaps and central-bank arrangements (e.g., the 2012 SAARC Currency Swap for INR), these tools let Africa–Asia partners transact directly in yuan, rupees, baht, etc., sidestepping U.S. dollar clearing entirely. These Africa–Asia corridors are quietly redefining trade in the Global South. By settling in local currencies, Asian and African countries reduce exposure to dollar volatility and Western sanctions. Exporters in countries facing dollar shortages (like Sri Lanka, Bangladesh, or many African economies) can keep exporting by switching to rupees or yuan. Importantly, this deepens economic ties on Asian terms: Chinese, Indian, Thai, or Malaysian lenders and investors gain leverage in financing and projects. At the same time, experts caution about the broader impact. The IMF notes that while local-currency arrangements improve resilience for participants, they also fragment the global payment system – potentially raising costs by up to ~7% of world GDP. For now, the dollar remains dominant in overall trade, but its share is slowly slipping in corridors driven by geopolitics and necessity. As one analysis put it, these developments embody a trade fragmentation trend away from the U.S. and Europe. In sum, African and Asian leaders are building new South–South financial infrastructure to match growing trade. These corridors – from Mombasa to Mumbai to Manila – unite continents through local currencies. They reflect a vision, voiced at forums like BRICS, of the Global South “speaking as one” and leveraging homegrown monetary systems. The result is a more multipolar commerce: one where African exporters may soon invoice in yuans or rupees instead of dollars, and Southeast Asian investors fund projects in local notes. In doing so, they redefine Global South commerce on their own terms.
johneb492254456


Chinese Investment and Yuan Settlements
 India’s Rupee Strategy in Africa
 ASEAN and Southeast Asian Initiatives
Alternative Payment Networks
Implications for Global South Commerce
Key Takeaways:
Why the UAE’s Digital Payment Surge is a Blueprint for Emerging Markets
October 1, 2025 by johneb492254456 The UAE’s payments landscape has shifted dramatically in the last few years. Government policies and fintech innovation have pushed the economy away from cash towards digital methods. For example, a 2023 Central Bank programme (‘Financial Infrastructure Transformation’) explicitly targets a cashless society by modernizing payments, including open banking rules and a trial digital dirham. This effort ties into broader strategies: the 2022 Digital Economy Strategy aims to double the digital sector’s share of non-oil GDP (from 11.7% to over 20%) within a decade. Such high-level coordination illustrates the UAE setting ambitious goals and taking aggressive steps to modernize payments – a model that other emerging economies can study. Central to this transformation is a cohesive regulatory framework. The UAE launched multiple coordinated initiatives: it mandated a unified open finance regime with APIs and consent-based data sharing, and created Al Etihad Payments (a national payments infrastructure entity) in 2023 to run shared rails. New systems were introduced, including a domestic payment card scheme (‘Jaywan’) and regulations for stablecoins. Even cross-border innovation is part of the plan: the UAE’s pilots for a digital dirham include a blockchain-based payment corridor with China. These concrete measures – all backed by federal “We the UAE 2031” and digital economy visions – show how strong policy leadership and new institutions can rapidly reshape a payment ecosystem. The private sector has responded energetically under this supportive regime. The UAE is now among the top 20 countries worldwide for fintech adoption, having drawn over $2.5 billion in fintech investment in 2022. Innovation zones like Abu Dhabi’s ADGM and Dubai’s DIFC operate regulatory sandboxes (RegLab, Innovation Testing Licenses) where startups test new payment apps, QR solutions and blockchain services with relaxed rules. As a result, dozens of fintech firms and digital banks (for example Zand, Wio, Liv.) launched highly user-friendly apps, while legacy banks modernized their offerings. Consumers have been quick to embrace digital options. Surveys show roughly 72% of UAE residents now prefer digital banking for its convenience and lower fees. In everyday payments, almost half of shoppers use mobile wallets (Apple Pay, Samsung Pay, bank apps, etc.), and contactless cards account for about 84% of all card transactions. The COVID-19 pandemic further accelerated this shift: non-cash payments rose from 39% of all transactions in 2018 to 73% by 2023. High smartphone penetration and trust in digital services underpin these numbers. Altogether, UAE consumers are rapidly moving away from cash, aligning their behavior with the government’s long-term cashless vision. Concrete data confirm the transition. The UAE built advanced payment rails: its Immediate Payment Instruction (IPI) scheme and upgraded Aani network now handle 24/7 instant interbank transfers. Cross-border capabilities are being added too, with experiments linking the UAE’s digital dirham to partner countries like India. These rails support a booming e-commerce sector: online retail reached $10.8 billion in 2024 and is projected to hit $17 billion in 2025, with over 71% of those sales paid by cards or digital wallets. At the industry level, total merchant acquiring volume hit about $150 billion in 2024 (a 13–14% CAGR since 2020). The UAE’s experience offers lessons for emerging economies worldwide. It highlights that success comes from building end-to-end ecosystems: interoperable platforms, supportive regulation, and a focus on inclusion. For example, expatriate remittances (roughly $40 billion outflows in 2023) are already 57% digital in the UAE, transforming financial flows between rich and developing nations. Similar patterns appear elsewhere: Latin America’s fintech-driven change is powered by open frameworks and instant-payment networks. Brazil’s Pix real-time system alone processed ~42 billion transactions in 2023, while digital wallets and QR payments now handle the majority of spending. In Southeast Asia, over 70% of e-commerce transactions were digital in 2023, supported by systems like Singapore’s PayNow (5.4m+ users) and Indonesia’s 45m mobile-wallet users. Looking ahead, the UAE remains ambitious. Dubai has set a goal of 90% cashless transactions by 2026, and polls suggest many citizens expect the UAE to be fully cashless by 2030. These targets reflect confidence that the coordinated strategy will continue yielding results. The blueprint is clear: concerted government leadership plus open, inclusive technology multiplies impact. In practice this means creating robust rails (real-time payments, digital ID/CBDC), enabling new entrants (sandboxes, data sharing), and educating consumers. Emerging economies can adopt this model: by aligning regulators, banks, fintechs and even remittance platforms around a common goal, a country can replicate the UAE’s trajectory. In sum, the UAE shows that even without being a large or low-income country, a market can achieve a rapid digital payments revolution through a well-designed ecosystem – a lesson for Latin America, Asia, Africa and beyond.
johneb492254456


Central Banks Are Fighting Inflation at 12% While Stablecoins Peg at 1:1 — Who’s Winning Trust?
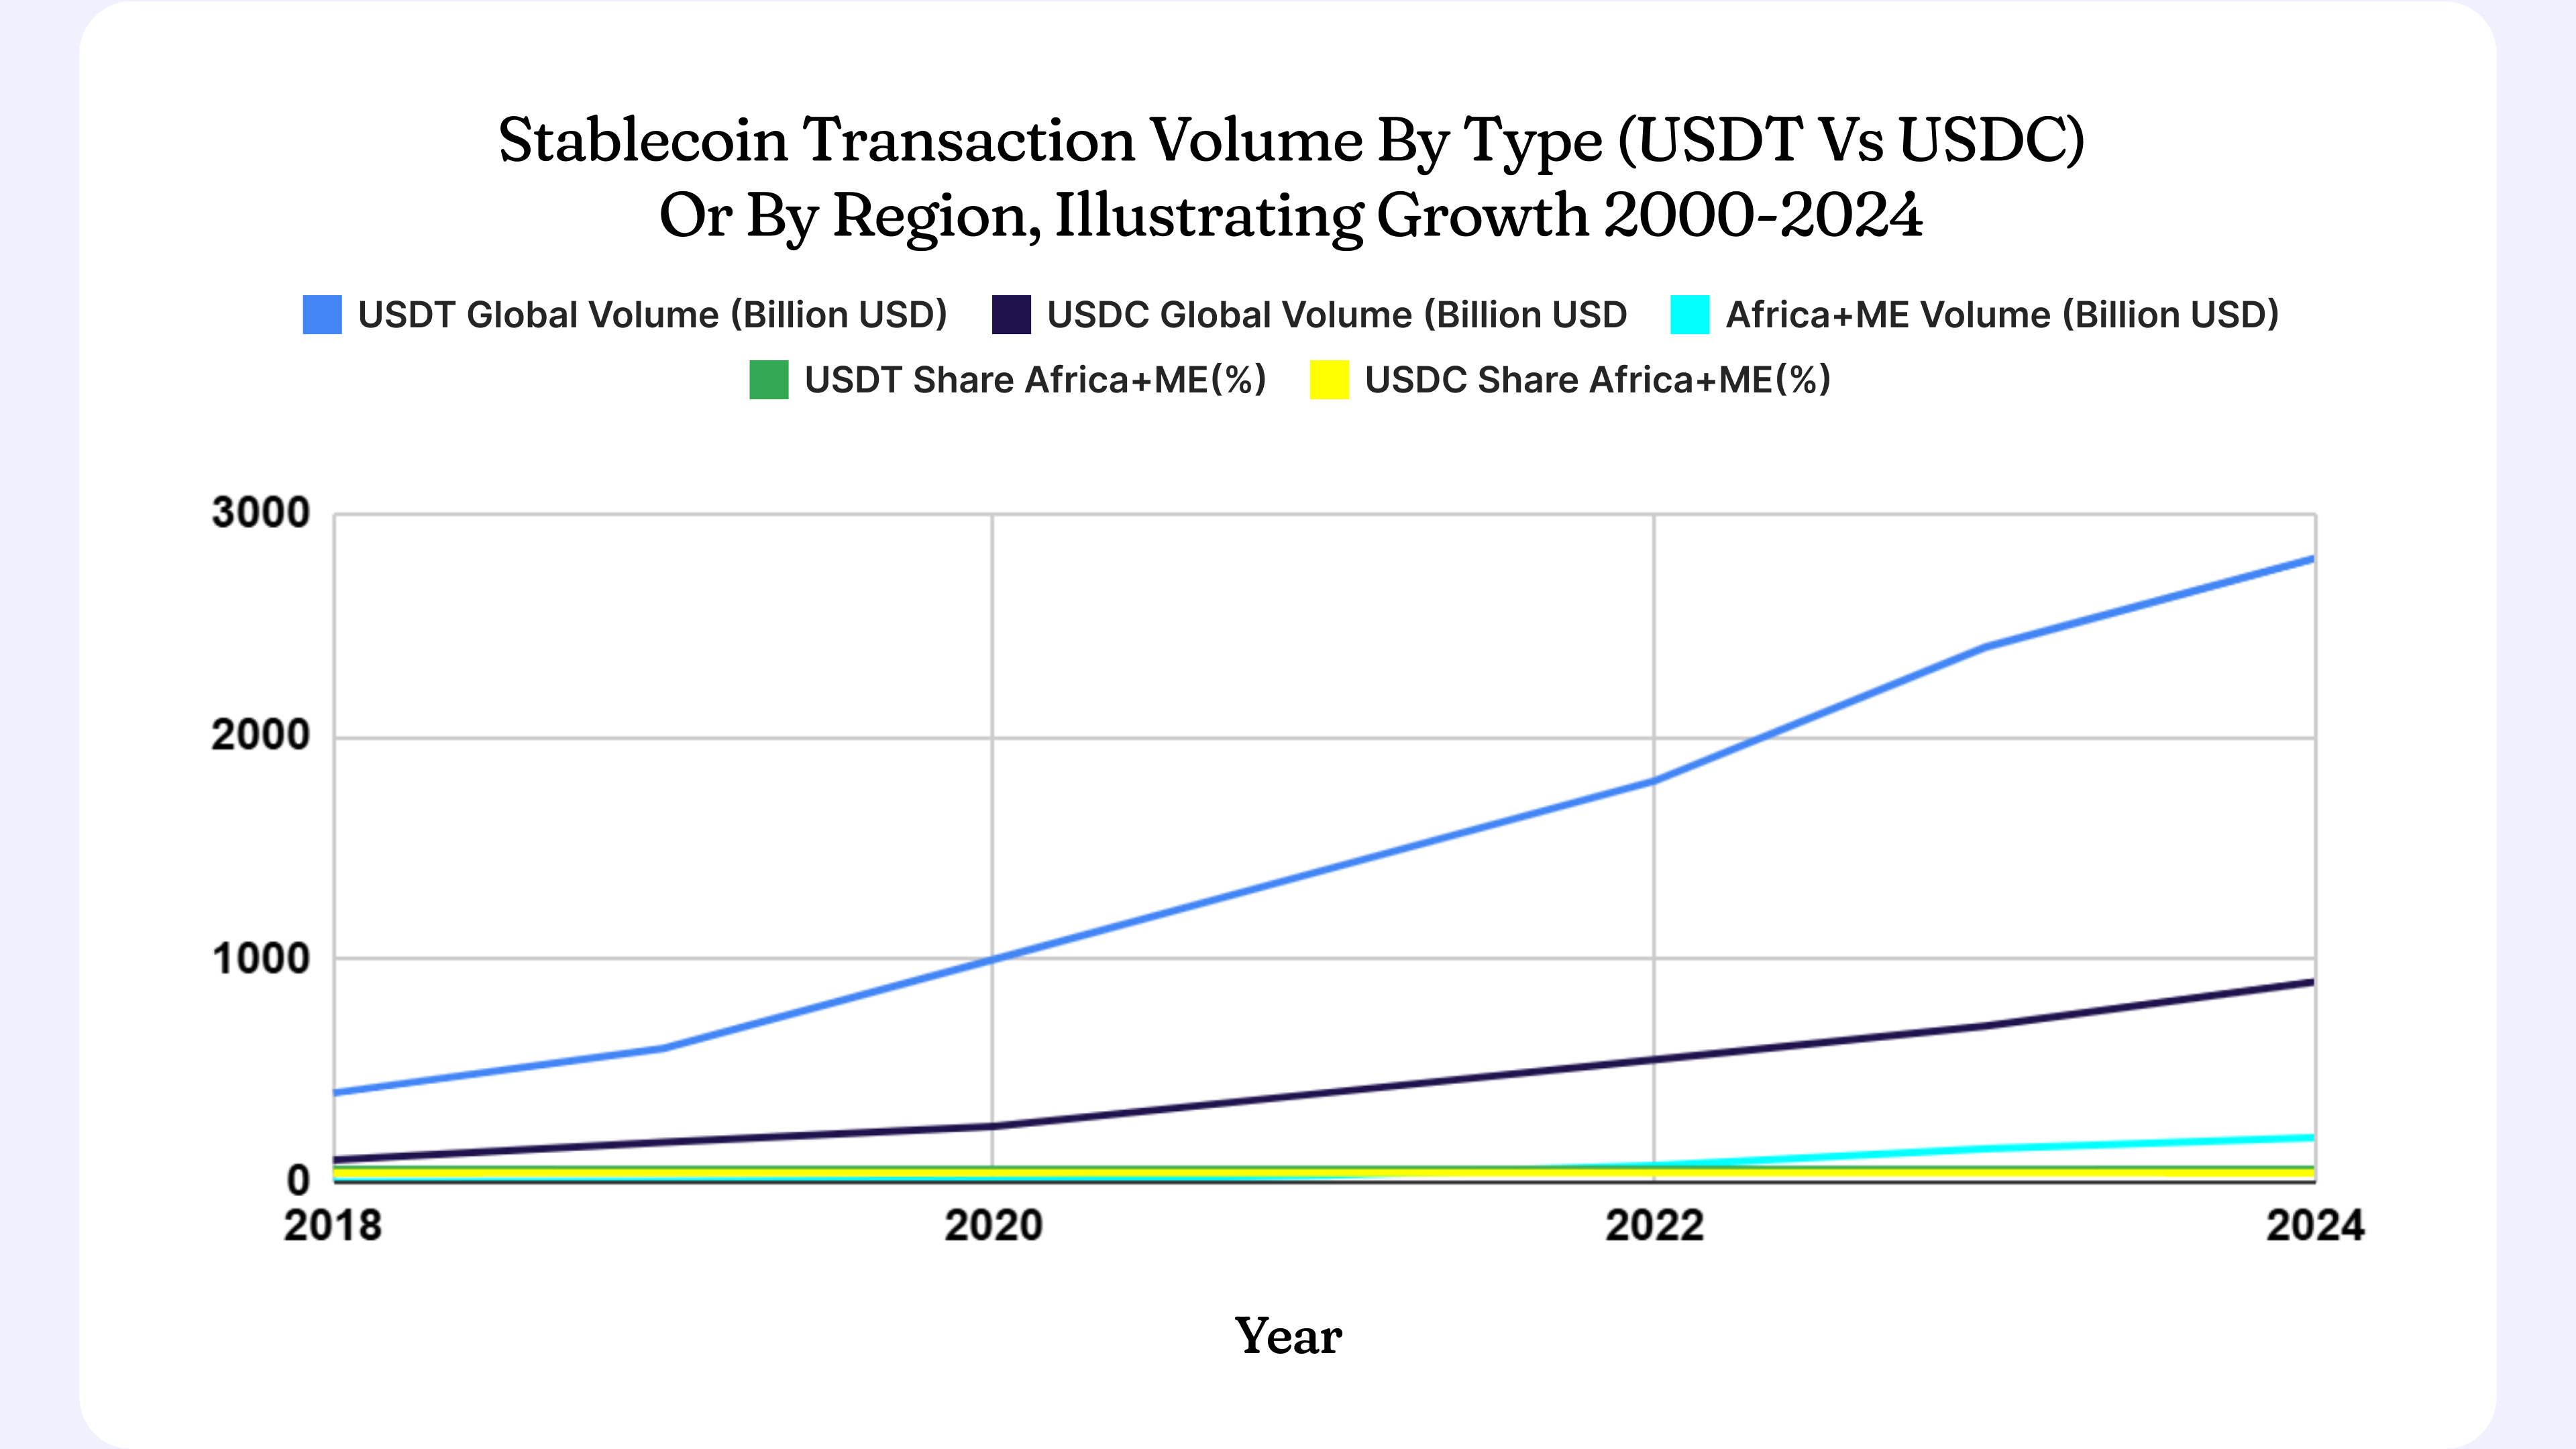
September 24, 2025 by johneb492254456 Central banks globally have embarked on aggressive rate hikes to tame rising prices. According to the IMF, world inflation surged to about 8.7% in 2022 before easing towards roughly 5% by 2024. In high-inflation economies, however, many citizens feel prices rising far faster. Stablecoins – cryptocurrency tokens pegged 1:1 to fiat dollars or euros – have become prominent alternatives. Unlike volatile crypto, stablecoins are explicitly designed “to preserve value” by holding reserves of real currency. This week’s StayWired explores how people’s trust is shifting: when local currency loses value daily, are dollar-backed tokens winning confidence? High inflation is not just a number – it’s a painful reality for consumers. For example, Nigeria’s currency lost roughly 40% of its value in 2023, effectively wiping out savings, and Zimbabwe continues to suffer triple-digit inflation. Central banks have responded by pushing interest rates to multi-year highs to rein in prices. The IMF notes that the global policy rate has been lifted aggressively; world inflation is forecast to fall from 8.7% (2022) to about 6–7% in 2023 and into the 5% range by 2024. Despite this, many countries still see double-digit inflation, undermining trust in fiat currency. In response, stablecoins have taken off as a “digital dollar” for the unbanked and those fleeing inflation. Stablecoins are crypto tokens whose value is backed by reserves (cash, bonds, etc.) so that 1 coin = 1 dollar. The market is dominated by tokens like Tether’s USDT and Circle’s USDC. An IMF analysis of $2 trillion in global crypto flows finds that Africa and the Middle East alone saw over $200 billion in stablecoin activity in 2024. Notably, USDT and USDC make up roughly 57% and 43% of that regional volume respectively. In fact, stablecoin transaction volume in Africa last year was equal to about 6.7% of GDP. Most of these transfers are cross-border – only about 14% of flows stay local – reflecting use in remittances and trade where banks are costly or slow. In many African markets, stablecoins now dominate crypto activity. For instance, Chainalysis reports that stablecoins accounted for roughly 43% of all crypto transaction value in Sub-Saharan Africa during mid-2023, far surpassing Bitcoin’s share. In Nigeria – Africa’s largest crypto market – over 70% of crypto trades are stablecoins, as citizens protect wealth against naira devaluation. Industry experts note that in this environment, stablecoins effectively serve as a “proxy for the dollar,” enabling businesses to continue operating when local FX is scarce. These data suggest that users are placing more trust in dollar-pegged tokens than in their own rapidly inflating currency. Over the 2020–2025 period, inflation and stablecoin usage have both spiked – but in opposite directions on trust. Global inflation climbed from pandemic lows to nearly 9% in 2022 and is only gradually falling. Meanwhile, crypto markets have grown dramatically. Chainalysis and IMF data show global crypto transaction volume reached $2 trillion in 2024, largely fueled by stablecoins. Stablecoins themselves are expanding: one analysis projects their market cap could reach $2 trillion by 2028. In short, as inflation expectations jumped in 2021–22, demand for stablecoins surged in many regions. For many Africans, the inflation-stablecoin story is very tangible. Countries that saw severe currency crises also saw huge jumps in stablecoin use. Ethiopia’s birr lost about 30% of its value in mid-2023, and in that period retail stablecoin transfers in Ethiopia jumped by roughly 180% year-over-year. The data show Ethiopia (+180%), Zambia (~+140%), and several others with double-figure gains. This matches on-the-ground reports: in Nigeria (inflation ~40% in late 2022) and Zimbabwe (hyperinflation), people turn to USDT/USDC to stabilize savings. For example, Ghanaian importers use stablecoins to bypass foreign currency shortages, and small traders in Kenya or Sudan use them for remittances and payment processing. The trend is clear: where local money fails, dollar-linked digital coins become the trusted alternative. Trust is shifting in Africa as inflation erodes confidence in local currencies. Stablecoins offer lower remittance costs and a fixed dollar peg, making them attractive in the short term. Yet they carry risks, as their credibility rests on transparent reserves. Central banks are responding with regulation and digital currency experiments to rebuild trust. The real test lies in whether fiat can restore price stability or stablecoins can maintain solid backing. Either way, this cycle is redefining what money people trust.
johneb492254456


How the U.S Fed’s First 2025 Rate Cut Is Shaping Global Capital Flows
September 19, 2025 by johneb492254456 In September 2025, the U.S. Federal Reserve cut its policy rate by 25 basis points to 4.00–4.25%, its first cut of the year. The Fed stressed continuing risks in the labor market even as inflation remains above target. Markets immediately responded: U.S. Treasury yields slipped, and the dollar weakened initially (USD index fell to multi-year lows). Equity markets were mixed (small- and mid-caps outperformed large tech) while gold and commodity prices rallied. Crucially, the dovish pivot has prompted a “great rotation” of capital out of dollar assets into foreign markets – especially higher-yielding emerging economies. Investors are now seeking higher returns abroad, easing debt costs for many EM borrowers but also raising risks of volatile hot-money flows and currency swings. In short, global capital flows in late 2025 are being driven by U.S. policy signals nearly as much as by local fundamentals. The Fed’s 25-bps cut on Sept 17, 2025, was framed as a risk-management move to offset cooling labor demand. Chair Powell emphasized that job gains had slowed and unemployment was edging up (to 4.3% in August). Despite inflation still running near 3%, the Fed signaled a gradual easing cycle: projections now show two further 2025 cuts (and markets price more). Policymakers’ dot-plot implied a year-end funds rate below previous forecasts (median now ~3.75%). However, the Fed also cautioned that risks to inflation remain, and that it will take “meeting-by-meeting” data-dependent steps. In practice, analysts say this means U.S. rates will still end 2025 only slightly lower than today. The key takeaway is the Fed’s bias has shifted to easing for now – a clear dovish turn that has global implications, though with less-than-full commitment to a big pivot. The Fed cut unleashed immediate moves across asset classes. Currency: The U.S. dollar fell sharply on the news, pushing the dollar index to its weakest level since early 2022. (Euro briefly rose above $1.19 after the cut.) This dollar pullback relieves some pressure on dollar-funded borrowers. Bonds: Treasuries initially rallied (prices up, yields down) reflecting easing expectations. The 10-year U.S. yield slipped toward ~4.01% post-announcement (though it later ticked up modestly by day’s end as markets priced in more cuts ahead). Equities: U.S. stocks had a mixed reaction – broad indexes hovered near record highs, but focus shifted from high-growth tech into interest-sensitive areas. Small- and mid-cap indices (Russell 2000, Dow) outperformed, while the Nasdaq lagged. Elsewhere, world equity markets climbed to new highs on Sept. 18, driven by U.S. optimism and dovish signals. Commodity & Other FX: Gold hit fresh highs on the dovish turn, and commodity exporters (oil, metals) benefited from the weaker dollar and higher global liquidity. The Fed’s shift immediately rippled through global capital flows. As U.S. yields drop relative to foreign yields and the dollar slides, investors have begun reallocating abroad. In practice, flows to higher-yielding regions resumed after a Fed-induced hiatus. For example, bond markets in Asia and elsewhere saw net foreign inflows in August (even before the cut) as markets anticipated easier U.S. policy. In August 2025, non-resident investors bought $311 million of Asian bonds net – the first positive inflow in three months. Key beneficiaries were India (+$773M) and Malaysia (+$721M), reversing prior outflows. (In contrast, South Korea, Indonesia, and Thailand still saw some net selling in Aug, reflecting idiosyncratic factors.) Analysts note that a cumulative ~125 bps of Fed cuts now expected by Q1 2026 would further buoy Asian currencies and asset markets. The benefits are uneven. Economies with solid fundamentals and export-oriented profiles are best placed to benefit. Asian economies – especially India and parts of Southeast Asia – have enjoyed inflows, as noted above. Latin American markets (e.g. Mexico, Brazil) also saw currency and equity gains, partly due to softer U.S. rates and stronger commodity prices. By contrast, some frontier markets are less accessible to large flows and can suffer volatility: a sudden influx can push their currencies and assets sharply up (risking bubbles), and any Fed disappointment later can trigger a painful reversal. Weaker commodity importers (e.g. some Asian economies) benefit from cheaper funding and a cheaper dollar, but their export sectors might face currency competition if their currencies appreciate. Within asset classes, bonds of higher-rated EM governments and corporates have seen particular demand. The Fed cut lowered global benchmark yields, making EM credit spreads look attractive again. According to one note, EM corporate bonds and high-yield sovereign debt should see renewed purchases as investors chase yield. Equities: Sectors like financials and real estate in EM typically do well when global rates ease. Conversely, consumer staples or defensives have less leverage to falling rates. U.S. sector-wise, banks and cyclicals rose while tech lagged immediately after the cut, reflecting rotation out of rate-sensitive growth stocks into more domestically cyclical plays (a trend noted by market strategists). While the easing cycle brings relief, it also stokes risks. Rapid “hot money” inflows can stress local markets: currencies may overshoot, fueling imported inflation in countries that import a lot, and central banks may feel forced to tighten to stem gains. Indeed, the trade-off between stronger currency and stable inflation is thorny. Unhedged investors in EM could face losses if U.S. rates turn back up unexpectedly, triggering capital flight. Moreover, the benefits are not uniform: countries with weak policy frameworks or high external deficits may not see large inflows (or may suffer if global sentiment turns). For instance, during 2022–23, economies with fragile fiscal or external balances saw capital flight and had to tighten policy, even when others held up. On the supply side, an easier U.S. policy means global funding conditions improve. In particular, U.S. Treasury auctions have been less crowded as domestic investors shift to foreign assets. Our sources note that large U.S. bond auctions now attract thinner demand, partially because foreign buyers (including central banks) see less yield premium. Meanwhile, emerging economies are seeing higher reserve accumulation as inflows resume, and their sovereign spreads have narrowed. Still, not all market segments have rebounded: September issuance by EM borrowers is typically low anyway, but any durable recovery in bond markets hinges on persistent Fed easing. The Fed signaled that cuts might total 50–75 bps by year-end, implying sustained dovish U.S. policy. If realized, this should continue to weaken the dollar and sustain flows into riskier assets. However, the Fed’s emphasis on “meeting-by-meeting” decisions means markets remain wary: as one strategist put it, “markets may welcome the easing bias, but the messaging remains nuanced and far from a full pivot”. A faster-than-expected slowdown in U.S. or global growth (or a spike in inflation) could prompt a U.S. policy reversal, triggering abrupt flow reversals. In sum, the Fed’s first 2025 rate cut has catalyzed a rotation of capital away from the U.S. toward global markets with higher yields. For institutional investors and corporate strategists, this shift means that portfolio returns will depend heavily on foreign-market positioning and currency management. Opportunities have opened in EM equities and bonds – but only for those who manage the accompanying volatility and geopolitical risks. Future U.S. policy moves will continue to be a key driver of cross-border flows. (Charts recommended: i) U.S. vs foreign interest rate paths and USD index; ii) net capital flows into EM bonds/markets over 2022–2025; iii) yield differentials between U.S. and key EM bonds; iv) FX moves vs time.)
johneb492254456

Fed Decision Context
Global Market Reaction
Impact on Capital Flows
Regional Effects & Sector Highlights
Risks & Challenges
Looking Ahead
Conclusion

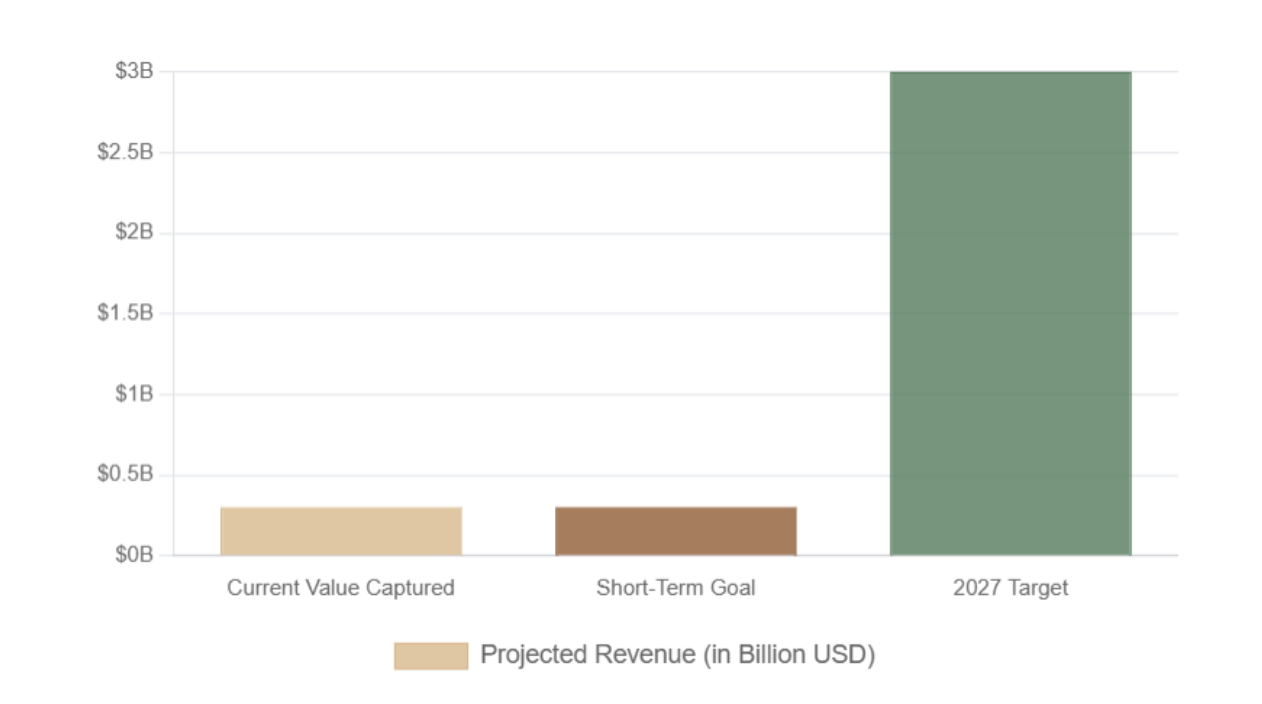
How Export Bans on Raw Shea Nuts Could Unlock $3 Billion in Local Value
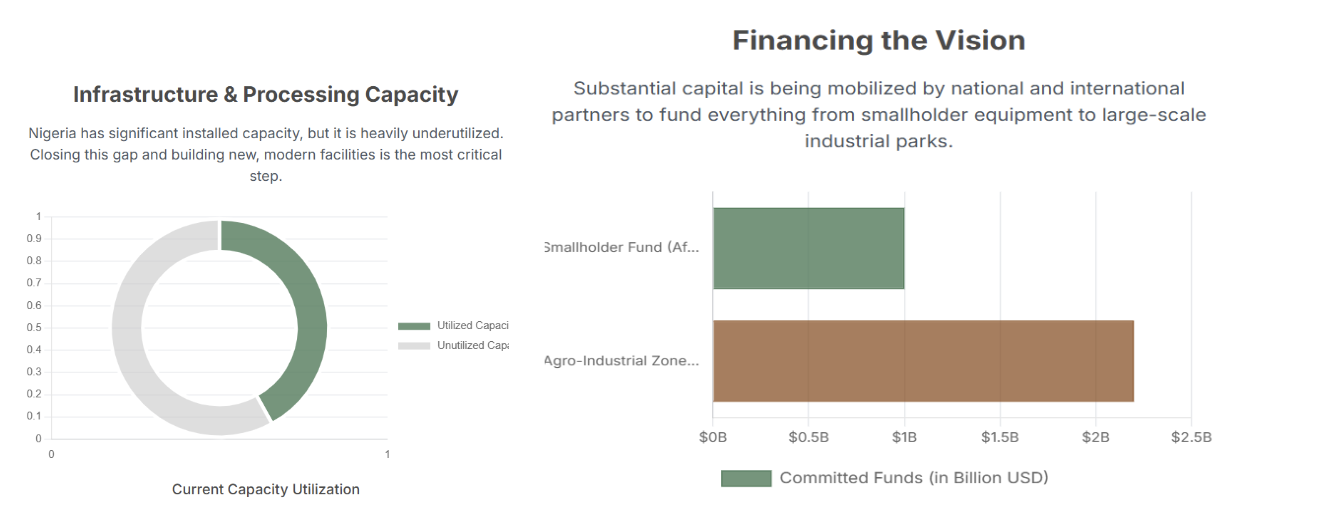
September 15, 2025 by johneb492254456 Nigeria is the world’s largest raw shea nut producer (roughly 350–500 thousand tonnes annually) but currently captures only a tiny share of the $6.5 billion global market. Until now most of Nigeria’s output was exported raw (with women collectors selling nuts cheaply to traders), while value-added products like shea butter were imported. On 26 August 2025 President Tinubu imposed a six-month ban on raw shea exports, aiming to redirect supply into domestic processing and boost Nigeria’s share of the market. Government projections are ambitious: roughly $300 million per year in new revenue short-term, and a “ten-fold” increase to about $3 billion by 2027. In effect, the policy is a deliberate shift from commodity export to industrialisation – “transforming Nigeria from an exporter of raw shea nut to a global supplier of refined shea butter, oil and other derivatives”. Regionally, Nigeria is joining a trend in West Africa toward raw-sheа bans. Ghana, Burkina Faso, Mali, Togo and others have moved to limit exports of unprocessed shea, aiming to build local industries. For example, Burkina Faso in late 2024 indefinitely suspended all shea nut exports to free up supply for domestic processors. Togo likewise paused its shea nut/kernels exports in April 2025 to feed local factories. Ghana plans a phased export ban by 2026 alongside rehabilitation of the old Buipe refinery to process 60,000 tpa (and create thousands of jobs). Economic analysts note that as West African producers coordinate restrictive policies, they can wield greater bargaining power (versus being mere exporters of raw nuts). Nigeria’s ban thus aligns it with these regional moves, but success will depend on matching policy with real investment in local industry. Turning Nigeria’s shea crop into $3 billion of refined products will require a major expansion of processing infrastructure. Today, only a handful of large-scale plants exist. For example, in September 2025, Niger State commissioned Africa’s largest shea butter refinery (Salid Agriculture) with 30,000 tonne/year capacity. But even with new facilities like this, national processing is far below potential. Official surveys find Nigeria has about 160,000 tpa of installed processing capacity, yet factories are running at only ~35–50% utilization. In practice, most raw nuts are still exported or processed manually in villages. Expanding capacity is vital. In addition to the Salid plant, other factory projects are underway under Nigerian Export-Import Bank (NEXIM) financing and public–private partnerships. NEXIM’s CEO notes that Nigeria produces ~60% of global shea nuts but “lacked industrial plants for quality processing,” and is now supporting multiple refineries. The federal Raw Materials R&D Council (RMRDC) is auditing and upgrading equipment, and planning clusters of small processing hubs. For example, RMRDC will roll out solar/diesel processing kits at village-level cooperatives and train cluster cooperatives on best practices. The government is also mapping millions of wild shea trees in 21 states to guide investment and ensure raw supply. Meanwhile, the African Development Bank and partners have mobilized about $2.2 billion for Special Agro-Industrial Processing Zones across Nigeria, aiming to build industrial parks (with infrastructure) where commodities like shea can be refined. In short, without rapid investment in modern plants, equipment, and zones, Nigeria cannot absorb its raw output into high-value industries. Nigeria’s policy hinges on securing raw inputs for processing. The country is unusually well-endowed – official figures cite about 5 million hectares of wild shea trees across the savannah. In practice, 90% of pickers and processors are rural women who collect nuts manually each season. But until now, much of this harvest has leaked abroad. An estimated 90,000 tonnes per year were lost to illicit cross-border trade. The ban is explicitly aimed at plugging these leaks: by prohibiting exports, domestic processors can buy directly from local collectors. To support that, authorities are taking steps like rural tree-planting and data collection. For example, Niger State (which holds 67% of Nigeria’s shea trees) recently pledged 10,000 ha to grow 10 million new trees, guaranteeing long-run supply for refineries. Nationwide, the RMRDC’s mapping will tell investors where nuts grow in abundance. Supply-chain improvements also include logistics and quality control. Traditional methods (sun-drying nuts on dirt floors) often yield inconsistent quality, which limits export markets. Experts emphasize the need for better drying, storage, and grading at the collection level. In practice, this means investing in community dryers, covered storage, and standardized sorting – activities that cooperatives and NGO projects can support. For instance, a women’s shea cooperative in Kwara State is already trialing improved post-harvest equipment under RMRDC guidance. If Nigeria can ensure a reliable, high-quality raw supply – combined with its mapping and afforestation measures – then domestic mills will have the feedstock they need to operate at scale. Scaling up Nigeria’s shea industry will require large capital infusions. The federal government and financial institutions have begun mobilizing funds for this. Notably, the African Export-Import Bank (Afreximbank) and Nigeria’s Bank of Agriculture just launched a $1 billion smallholder fund. That fund will offer blended financing for inputs, farm mechanization, processing equipment, and market access for Nigeria’s ~95% smallholder agriculture workforce – including shea collectors. Similarly, NEXIM Bank has financed the new 30k tpa plant in Kudu and says it will back at least four more processing projects nationwide. At the same time, international donors (e.g. Japan’s JICA, IFAD, and Islamic Development Bank) are contributing to Nigeria’s agro-industrial agenda Industry associations also call for targeted incentives. The National Shea Products Association of Nigeria (NASPAN) has urged the creation of a Shea Marketing Board, minimum price guarantees, and equipment grants for processors. BusinessDay reports that stakeholders want equipment subsidies (solar-powered presses, decorticators, packaging machines) and rural electricity solutions to run them. In practice, some state governments are already offering tax breaks and land to investors (e.g. Niger State granted a tax holiday and agro-processing zone status to Salid’s plant). Meanwhile, climate-oriented funds (like the Climate-Smart Agricultural initiatives) could co-finance shea agroforestry and carbon projects, indirectly supporting the industry. In sum, a combination of concessional loans, private equity and government grants will be needed to build the full value chain. Nigeria’s ban comes as global shea demand is rising. Shea butter is now a crucial cocoa butter substitute and cosmetic ingredient, pushing the projected global market from $6.5 billion today toward about $9 billion by 2030. The Nigerian government has even negotiated preferential access abroad – for instance, agreeing with Brazil to prioritize imports of Nigerian shea products. Together with similar bans in neighboring countries, Nigeria may soon coordinate on pricing. However, there are risks: price arbitrage could spur smuggling if one country’s farmgate price is much higher than its neighbors’. For example, Mali’s 2025 minimum price (CFA250/kg) is ~70% lower than Ghana’s (CFA433/kg), tempting traders to move nuts across borders. Nigeria has yet to announce its own minimum prices, but industry analysts stress that harmonizing pricing and export rules with neighbors will be essential to prevent illicit flows. In summary, Nigeria must balance its regional strategy: the ban should strengthen collective bargaining over the supply chain, but it also requires coordination to prevent turning Nigeria into simply a transit depot for smuggled nuts. The shea sector’s workforce is overwhelmingly female – estimates are that roughly 90% of all harvesters and village processors are women. Thus the export ban is essentially a “rural women’s empowerment” policy. If implemented well, it can create tens of thousands of jobs and boost incomes in the north. For example, analysts calculate that adding even simple value (crushing to butter) could raise rural earnings from virtually zero up to $300 million per year in the near term. Over time, processing could anchor new cooperatives and ancillary businesses in remote areas – herbariums, soap-makers, local markets – giving women new revenue streams. President Tinubu and his ministers have emphasized this gender angle: protecting the shea value chain is seen as “protecting livelihoods… dignity and opportunity for millions of our women”. However, experts warn the transition could fail unless women’s needs are explicitly addressed. Early reports show farmgate nut prices falling (because export buyers are sidelined), squeezing the very people the policy is meant to help. Observers urge safeguards: introduce minimum prices or buffer stocks so women collectors aren’t forced to sell at rock-bottom rates. They also stress building cooperatives and providing rural infrastructure. For example, RMRDC plans “women cluster cooperatives” across all shea states to train on safe collection and quality control. These cooperatives would qualify for shared equipment (solar dryers, grinders) and credit lines. Similarly, BusinessDay notes that empowering rural women will require reliable electricity (often via off-grid renewables) and access to finance for processing machines. Without these supports, local processors (mostly women) may lack affordable credit and remain unable to export competitively. In short, success hinges on not just banning exports, but fully integrating women-led cooperatives into the value chain, so they “rise as the true custodians of a billion-dollar industry”. The pivot to processing opens many investment avenues: In summary, every step up the supply chain – from farm-gate cooperative ventures to high-tech exports – represents an investment opportunity. Publicly-backed funds and policy (e.g., export incentives, guaranteed buyers) will be needed to catalyze these ventures. The upside is large, but so are the risks if implementation lags. Major concerns include: Nigeria’s experience will be watched closely by neighbors and industry alike. But if infrastructure and financing are marshaled in time, the ban could indeed plant the seeds of a $3 billion shea industry. If not, the country risks repeating the old pattern: exporting its natural wealth but missing out on most of the value and leaving rural women at the margins.
johneb492254456

Introduction
Processing Infrastructure and Capacity Needs
 Inputs, Supply Chain, and Raw Material Security
Financing and Investment Support
 Regional Market Dynamics
Socio-Economic Impact: Rural Women and Cooperatives
Investment Opportunities in a Shea Economy
Challenges and Considerations

Return to Sender: Why 60% of Cross-Border Orders in Africa Never Get Delivered
September 3, 2025 by johneb492254456 Africa’s digital marketplace is surging. With internet penetration and smartphone use climbing, the number of online shoppers is growing at a double-digit rate. Forecasts estimated over 500 million African e-commerce users by 2025 (about 40% of the population), reflecting explosive consumer demand. Yet this boom masks a paradox: an alarmingly high share of cross-border orders never arrive. In practice, many African buyers distrust unknown sellers and simply refuse cash-on-delivery (COD) packages. Industry observers report that in parts of Africa over 90% of COD shipments are rejected by recipients. In other words, only about 60% of parcels are successfully “signed off” by customers. This means roughly four out of ten shipments fail – a phenomenon sometimes called “return to sender” – which threatens to undercut the growth of online retail across the continent. Many African consumers remain unbanked or underbanked. Official data show nearly half of African adults lack a formal bank account, so cash and mobile money dominate payments. E-commerce sites therefore often rely on cash-on-delivery, where buyers pay only upon receiving the package. In theory this builds trust, but in practice it causes huge losses: couriers deliver goods without guaranteed payment, and recipients can simply refuse the parcel. In fact, one logistics study found refusal rates on African COD deliveries above 90%. Poor infrastructure further throttles deliveries. In much of Sub-Saharan Africa, roads are rough or impassable during rains, and formal street addresses or postal codes are often lacking. This makes “last-mile” delivery extremely slow and error-prone. One analysis found that average e-commerce delivery times in sub-Saharan Africa stretch 10–14 days, versus just 2–5 days in developed countries. Rural parcels may never arrive if the courier can’t find the village, and even urban slums have no formal house numbers. Tracking systems are limited, so sellers and buyers lose visibility once a package leaves the dispatch warehouse. In practice, this means many packages are delayed or returned. Complex customs and high import costs add still more roadblocks. Many African governments levy steep tariffs to raise revenue – for example, buyers in Nigeria may pay 20–30% extra in duties on an imported smartphone. These extra charges discourage cross-border orders and delay clearance. Moreover, border processes are notoriously slow and opaque. The African Development Bank has reported that transport and border delays can account for as much as 40% of logistics costs in some regions. For instance, queues of trucks at busy crossings (like Beitbridge between South Africa and Zimbabwe) regularly last days or weeks. Each wasted hour at a border means price inflation, spoilage of time-sensitive goods, and often a canceled delivery Despite these challenges, a number of solutions are taking root. African policymakers are pushing reforms to smooth trade. The African Union’s 2030 Digital Transformation Strategy explicitly aims to create a continental digital single market: harmonizing e-commerce laws, integrating mobile-money systems across borders, and even improving postal addressing systems. Likewise, the AfCFTA negotiations include provisions for e-commerce: e-signatures, data flow rules, and exemptions on low-value e-shipments are on the agenda. Some governments are already digitizing customs: Rwanda’s electronic single-window system, for example, slashed clearance times from 11 days down to under 24 hours. International finance agencies are funding “smart border” projects, installing scanners and common IT platforms to cut delays. Africa’s cross-border e-commerce is at a crossroads. The prize is huge – connecting 1.4 billion people to a $1+ trillion market – but only if systemic hurdles are cleared. Development agencies note that a truly frictionless AfCFTA could lift 30 million Africans out of extreme poverty by boosting trade. Achieving that vision requires both smarter borders and better last-mile networks. If governments harmonize tariffs and digitize customs, and if companies invest in infrastructure and consumer assurance, then the current “return to sender” trend can be reversed. As one analysis concludes, by resolving these issues “Africa can create a more vibrant and inclusive e-commerce sector that benefits businesses, consumers and the economy as a whole”. In summary, the continent’s e-commerce promise depends on strengthening the physical delivery system: until then, too many orders will keep coming back
johneb492254456

 Such non-payment means massive wasted shipments. Compounding the problem, sellers report a high incidence of bogus orders: without prepaid credit cards, some people place orders with fake names or addresses on purpose. Call-center agents note that in many African markets “a high percentage of fake or junk orders” arrive with incorrect delivery details. These dead-end orders inevitably go back to the sender. In short, Africa’s payment gap and COD model fuel mistrust and junk orders, so only a minority of intended sales actually turn into successful deliveries.