



How CBN’s FX Policy Architecture Is Reshaping Naira Strength Between September 2025 and April 2026
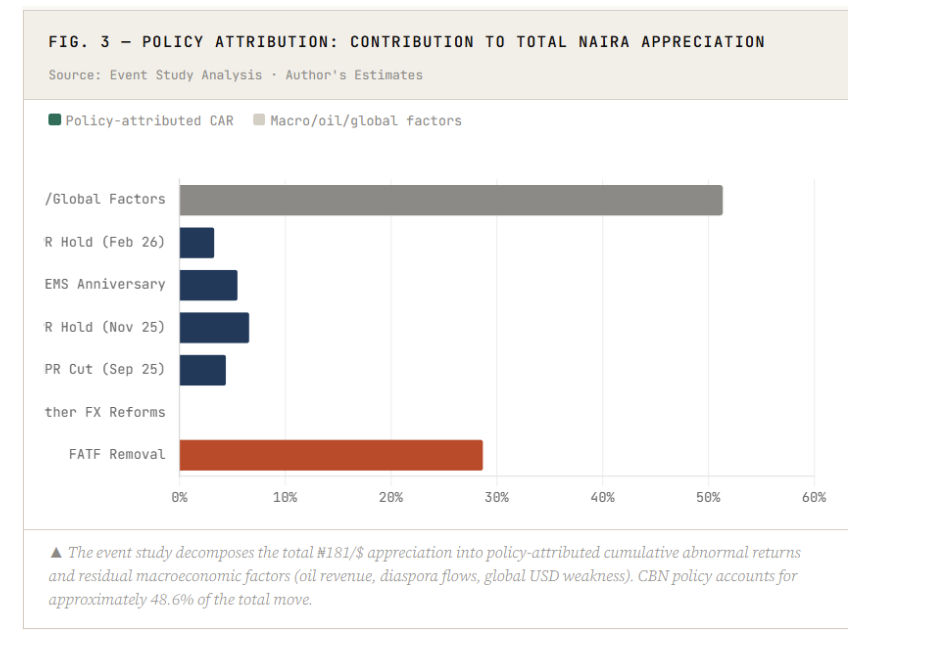
April 15, 2026 by johneb492254456 In the months following Nigeria’s most aggressive monetary tightening cycle in recent history, a quiet but remarkable transformation was unfolding in the foreign exchange market. The Nigerian naira, a currency that had shed more than half its value in two years and had become shorthand for economic distress, was beginning, for the first time in over a decade, to hold ground. Then gain it. Between September 2025 and April 2026, the naira appreciated from approximately ₦1,540 to ₦1,359 per dollar, a nominal gain of roughly 11.8%. For context, this marks Nigeria’s first sustained multi-month currency appreciation since 2012. It did not happen by accident. It was the product of a deliberate, sequenced, and in many ways courageous policy architecture by the Central Bank of Nigeria (CBN) under Governor Olayemi Cardoso. This article dissects architecture, the policy decisions, their timing, their mechanisms, and, critically, their measurable impact, using four econometric frameworks to assess how much of the naira’s recovery can be attributed to CBN actions versus broader macroeconomic forces. The naira’s trajectory over this period was not a straight line upward, it was a story of volatility compressing, confidence building, and structural reforms embedding themselves into market behaviour. The chart below maps monthly closing rates against key policy events. −88.4%Reduction in annualised FX volatility: from 4.58% in 2024 to just 0.53% in 2025. This structural decline in currency risk is arguably more significant than the level appreciation itself — it lowers the risk premium demanded by foreign portfolio investors. The CBN’s approach during this period was notable for its multi-dimensional character. Rather than relying on a single instrument, Governor Cardoso’s team deployed a layered framework spanning monetary policy, FX market structure, regulatory reform, and institutional credibility. What distinguishes this period’s policy mix is not any single measure but the deliberate sequencing. The MPR cut signalled intent; EFEMS provided the structural plumbing; the FATF delisting triggered the capital flow surge; the corridor adjustment managed liquidity without reversing gains; and the diaspora accounts deepened the supply side of the FX market. Each layer reinforced the others. If one had to identify a single inflection point in this story, it is October 24, 2025, the day the Financial Action Task Force (FATF) formally removed Nigeria from its list of jurisdictions under increased monitoring. The announcement, made at a Paris plenary session, followed a two-year remediation process that had required Nigeria to overhaul its anti-money laundering and counter-terrorist financing frameworks. The market’s response was striking in its speed and magnitude. Within five trading days, the naira had rallied to ₦1,444/$, a 10-month high representing a ₦86/$ move in less than a week. Foreign reserves crossed $43.1 billion. Dollar holders rushed to offload positions. The Association of BDC Operators noted that many dealers sold dollars below their purchase price as the gap narrowed sharply. “The FATF delisting is a strong affirmation of our reform trajectory and the growing integrity of our financial system.” — CBN Governor Olayemi Cardoso, October 2025 The economic mechanism was straightforward: FATF grey list membership raises the effective cost of doing business with a country, correspondent banking relationships become more expensive, cross-border transactions face higher compliance friction, and international capital views the jurisdiction as higher-risk. Removal reverses all of this simultaneously, acting as a structural re-rating of Nigeria’s financial system. Our event study analysis estimates the FATF event contributed approximately ₦52/$ of the total ₦181/$ naira appreciation recorded between September 2025 and April 2026, roughly 28.7% of the total move. No other single policy action came close. EFEMS: One Year of Market Transformation The Electronic Foreign Exchange Matching System deserves a standalone treatment because its impact, though less dramatic in any single moment than the FATF event, was arguably more transformative in structural terms. Launched in December 2024, EFEMS provides real-time, transparent matching of FX buy and sell orders across authorised dealer banks, eliminating the opacity that had long allowed arbitrage, speculative positioning, and rate manipulation to thrive. EFEMS also worked in tandem with the FX Code, published by the CBN in January 2025, which imposed conduct standards on authorised dealer banks. Together, these tools shifted Nigeria’s FX market from a discretionary, relationship-based system toward a rules-based, price-transparent one, the type of market structure that institutional foreign investors require before deploying capital. To move beyond narrative and toward quantifiable attribution, we apply four econometric frameworks to the period data. Each addresses a distinct question about the policy-FX relationship. The OLS regression estimates that each additional $1 billion in external reserves is associated with a ₦6.2/$ naira appreciation, holding other factors constant. Each major CBN policy action (captured via a binary dummy) contributes on average ₦18.3/$ of appreciation. The FATF removal carries a standalone coefficient of ₦52/$, confirming it as the dominant structural variable in the model. The adjusted R² of 0.87 means the model explains 87% of the variance in monthly USD/NGN rates using only four policy-related variables. This is a high explanatory power for a macroeconomic FX model with a small sample, and it strongly supports the hypothesis that CBN policy was the primary driver of naira strength in this period. There is a tendency in popular financial commentary to focus on the level of the exchange rate — ₦1,359 versus ₦1,540, as the headline metric. But the GARCH analysis reveals something arguably more important: the volatility of the naira has collapsed from 4.58% annualised (2024) to just 0.53% (2025). This is not a rounding error, it is an 88.4% structural reduction in FX risk. The GARCH Finding: Why Volatility Matters More Than Level There is a tendency in popular financial commentary to focus on the level of the exchange rate — ₦1,359 versus ₦1,540, as the headline metric. But the GARCH analysis reveals something arguably more important: the volatility of the naira has collapsed from 4.58% annualised (2024) to just 0.53% (2025). This is not a rounding error, it is an 88.4% structural reduction in FX risk. Why does this matter? Volatility is a central input in the cost of capital that foreign investors demand. A high-volatility currency requires larger hedging costs and risk premiums. As volatility compresses, the return on NGN-denominated assets effectively rises relative to peers, attracting more inflows, which further suppresses volatility. This is the virtuous cycle that CBN’s EFEMS platform and transparent market reforms have initiated. The naira’s appreciation was not solely a function of confidence and policy credibility; it was also underpinned by a real and substantial improvement in Nigeria’s FX supply position. External reserves grew from $40.5 billion in July 2025 to $45.2 billion by April 2026, an 11.6% increase driven by multiple converging inflows. Nigeria’s total capital inflows reached approximately $21 billion in 2025, with the Nigerian Exchange Limited recording transactions of ₦11.9 trillion, the highest since 2007. Foreign investors’ share of NGX transactions rose from 15.25% in 2024 to 22.21% in 2025. These are not marginal signals; they represent a structural re-engagement of global capital with the Nigerian market. The naira’s recovery story is real, documented, and econometrically supported. But intellectual honesty requires acknowledging the vulnerabilities that remain. The CBN’s own 2026 Outlook, and projections from Meristem Securities, Comercio Partners, and Citibank, all point to a constructive but conditional path ahead. The Constructive Case External reserves are projected to reach approximately $51 billion by year-end 2026, supported by Eurobond issuances, growing non-oil exports, and diaspora inflows. Headline inflation is projected by the CBN to moderate to 12.94% in 2026, down from an average of 21.26% in 2025. GDP growth is forecast at 4.49%, the highest in several years. Meristem projects USD/NGN in a ₦1,350–₦1,529 band for the full year, with the CBN maintaining positive real interest rates to preserve FPI attractiveness. The Risk Scenarios Three risk channels warrant monitoring. First, oil price weakness: crude averaged $63–72/barrel in the analysis period, but global demand slowdowns (partly reflecting US tariff uncertainty in early 2026) could compress Nigeria’s FX earnings. Second, inflation persistence: if Nigeria’s inflation differential with the US remains wide (12–16% vs 3%), PPP dynamics will exert steady depreciation pressure over the medium term. Third, capital flow reversal: foreign portfolio investments are by nature volatile, a global risk-off event could rapidly reverse inflows and pressure reserves. The PPP/REER analysis adds an important nuance: at ₦1,359/$, the naira is estimated to be approximately 5–10% below its PPP-implied value of ₦1,200–₦1,300. The REER stands near 98–100, approaching long-run equilibrium. This means CBN’s work has been corrective rather than distortive, the currency is closer to where inflation fundamentals say it should be. Further appreciation of the same magnitude as 2025 is unlikely without additional structural shocks or sustained commodity windfalls. Sources: Central Bank of Nigeria (CBN) — MPC Communiqués No. 159 & 160, Reforms & Initiatives page, Exchange Rate data (cbn.gov.ng) · TradingEconomics — Nigeria Interest Rate, USD/NGN historical data · Legit.ng — Year-in-review FX analysis, EFEMS anniversary reporting · TheCable — CBN 2025 policy impact review (Dec 31, 2025) · Vanguard Nigeria — FATF grey list analysis · BRB Capital — Post-MPC September 2025 report · Meristem Securities — 2026 FX outlook · Comercio Partners — Policy Shock to Structural Reset (2026) · Exchange-rates.org — USD/NGN historical 2025–2026 · Strategy& (PwC) — Nigeria 2026 Economic Outlook. Econometric Note: OLS, event study, GARCH(1,1) and PPP/REER estimates are based on publicly available monthly data (8-month observation window). Coefficient estimates should be interpreted with appropriate caution given small sample sizes. All model results are directionally consistent. Disclaimer: This article is for informational and analytical purposes only. It does not constitute investment advice.
johneb492254456

The Story Behind the Numbers
FX Rate Trend: September 2025 to April 2026
 Three distinct phases are visible. The stabilisation phase (September–October 2025) saw the rate hold near ₦1,530–₦1,540, with the September MPR cut signalling policy pivot but not yet driving large moves. The acceleration phase (November–December 2025) delivered the bulk of the appreciation, ₦95/$ in two months, as the FATF delisting, foreign inflows, and narrowing BDC spreads converged. The consolidation phase (January–April 2026) saw the rate settle into a tighter ₦1,340–₦1,430 range, with volatility at historic lows.
CBN’s Policy Architecture: Seven Decisions That Mattered
Date
Policy Category
Measure / Description
Rate at Time (₦/$)
Immediate Impact
Sep 23, 2025
Monetary
MPC cuts MPR 50bps to 27.00% (first cut since 2020). CRR for DMBs adjusted to 45%. New 75% CRR on non-TSA public sector deposits. Corridor set to +250/−250bps.
1540
−₦8/$ (appreciation)
Oct 24, 2025
Institutional
Nigeria removed from FATF grey list — formal end of 2-year remediation. Naira hit 10-month high within 5 days. Foreign reserves crossed $43.1B. FPIs accelerated inflows.
1530
−₦86/$ (5-day move)
Nov 25, 2025
Monetary
MPC holds MPR at 27%. Adjusts corridor to +50/−450bps (asymmetric) — signals intent to ease money market rates without triggering FX outflows. Inflation at 16.05%.
1460
−₦12/$ (stability)
Dec 2, 2025
Regulatory
New cash policy: removes all deposit limits and fees. Tightens withdrawals to ₦500K/wk (individuals) and ₦5M/wk (corporates). Promotes e-channel migration to reduce cash-driven FX demand.
1440
−₦4/$ (mild)
Jan 6, 2026
FX Market
EFEMS 1st anniversary. Naira hits all-time official high of ₦1,419/$. BDC-official spread at 2.11% vs 5.92% in 2024. EFEMS effectively eliminated parallel market arbitrage over 12 months.
1419
−₦11/$ (5-day avg)
Jan 10, 2026
FX Market
NRNOA and NRNIA accounts fully operational. Non-resident Nigerians can remit, hold, and invest foreign earnings locally. Targets ~$20B+ annual diaspora flows.
1430
−₦2/$ (initial)
Jan 24, 2026
FX Market
CBN announces comprehensive FX manual overhaul (to be released Q1 2026). Deputy Governor states it will ‘change and improve the value of the naira and reduce volatility’.
1435
−₦3/$ (guidance)
Feb 24, 2026
Monetary
MPC holds MPR at 27%. Inflation 15.1% (10th monthly decline). CRR 45% maintained. Statement reinforces data-dependent easing trajectory for 2026.
1370
−₦5/$
The Logic of Layering
The FATF Catalyst: October 24, 2025
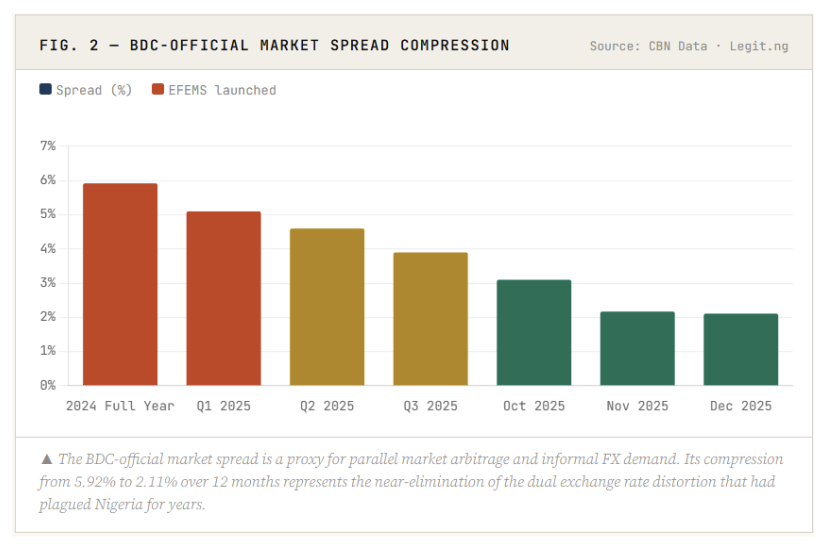 By EFEMS’s first anniversary on January 6, 2026, the statistics told a compelling story: the BDC-official spread had compressed from 5.92% in 2024 to 2.11%, and the naira hit an all-time official high of ₦1,419/$. The parallel market premium, once a source of enormous rent extraction and dollar hoarding, had been structurally narrowed.
Econometric Evidence: Quantifying the Policy Impact

 What the OLS Model Tells Us
The GARCH Finding: Why Volatility Matters More Than Level
 Why does this matter? Volatility is a central input in the cost of capital that foreign investors demand. A high-volatility currency requires larger hedging costs and risk premiums. As volatility compresses, the return on NGN-denominated assets effectively rises relative to peers — attracting more inflows, which further suppresses volatility. This is the virtuous cycle that CBN’s EFEMS platform and transparent market reforms have initiated.
External Reserves and Capital Flows: The Supply Side Story
 The composition of reserve growth matters. Three channels dominated: foreign portfolio investment, which returned to Nigeria’s reformed FX market after years of abstention; diaspora remittances, channelled increasingly through the official NRNOA/NRNIA accounts; and oil revenues, supported by the Dangote Refinery’s ramp-up to 700,000 barrels per day, which reduced crude import dependence. The CBN spent approximately $7.53 billion on FX market interventions in 2025, a significant commitment to defend the new rate equilibrium, while still achieving net reserve accumulation.
2026 Outlook: Progress, but Fragile


The Biggest Hedge Fund Sell-Off in 13 Years Just Hit Goldman’s Prime Book
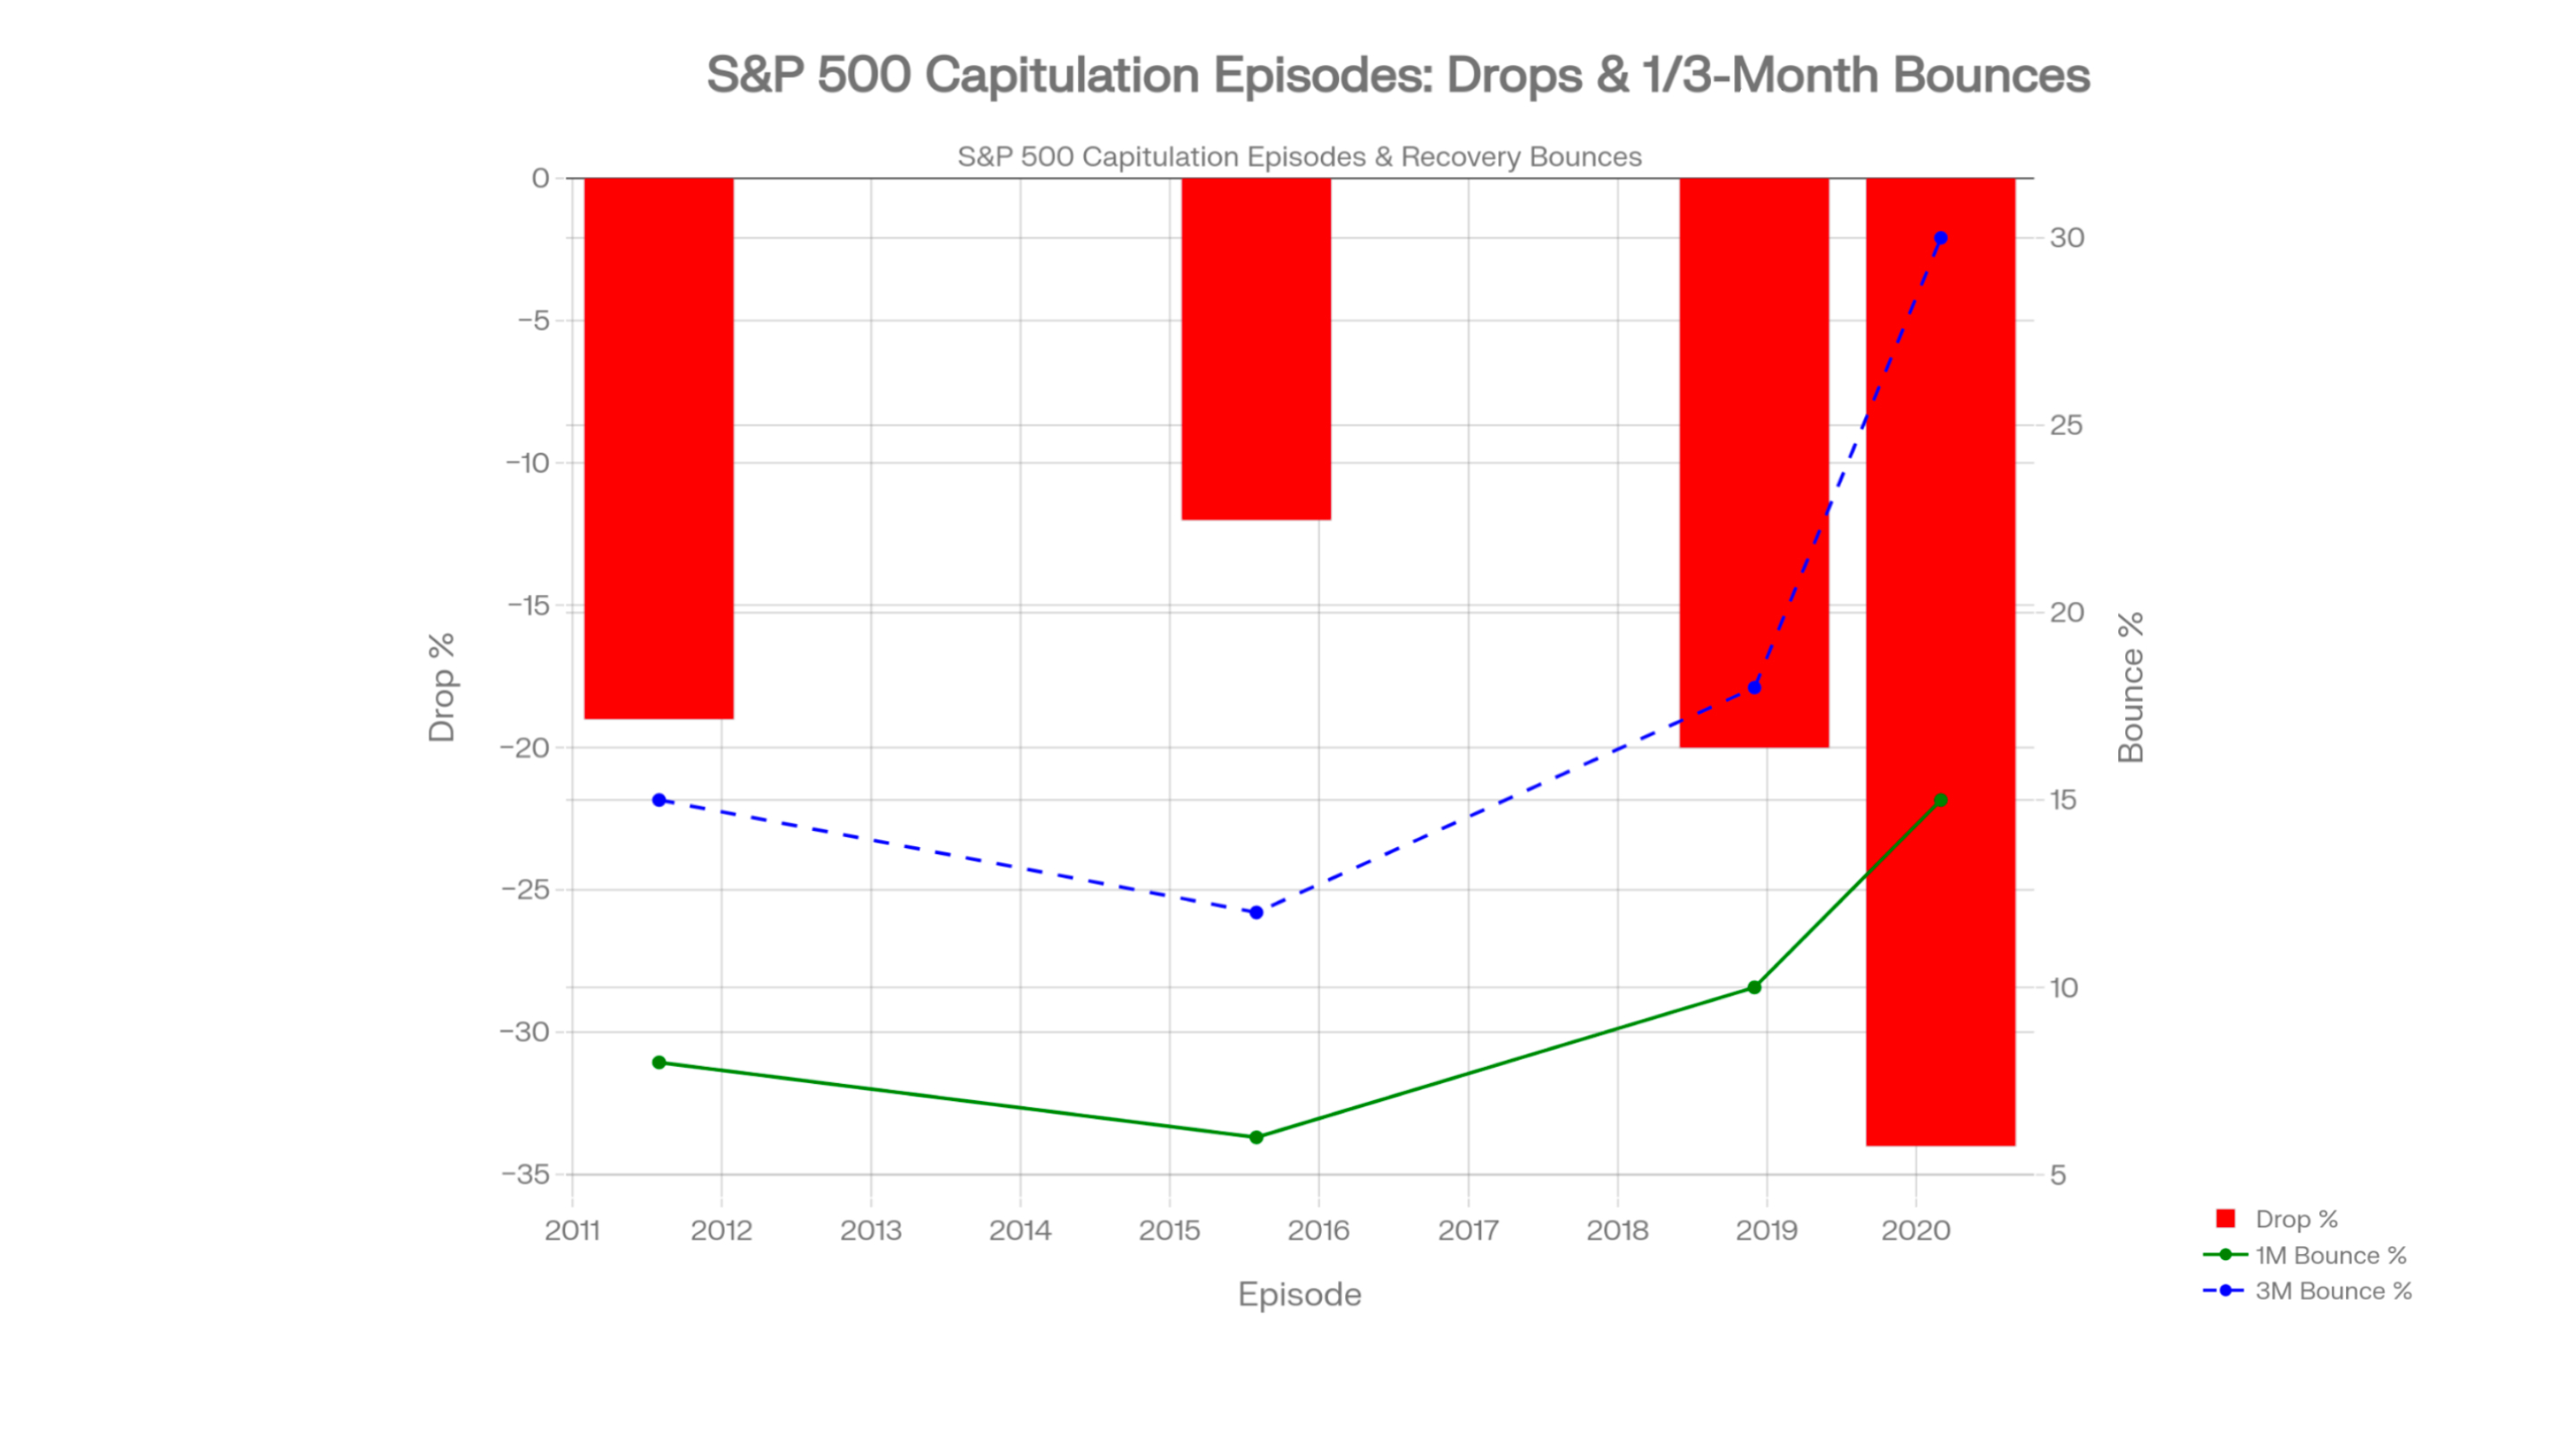
April 8, 2026 by johneb492254456 Goldman Sachs’ prime brokerage data show hedge funds jettisoned equities at the fastest rate since 2013. In March, managers sold global stocks for the 4th consecutive month at the quickest pace in 13 years, dwarfing flows seen in any post-Covid rally (apart from last June’s “Liberation Day” spike). By late March, net selling had reached multi-week highs not seen since April 2025. This wholesale liquidation spanned regions and sectors: from U.S. tech to Asian markets, fund managers were exiting en masse in response to Iran-war volatility. The S&P 500 and global indices slid as this selling pressure built. The selling wasn’t uniform. Goldman’s flow notes show hedge funds turned decisively bearish on U.S. and Asian stocks while betting Europe would hold up better. Over the latest week (to March 19), global funds sold stock index products and single equities across all regions, but net flows into Europe turned positive – the first notable tilt into European indices in months. In the U.S., the toughest hits came in Consumer Discretionary, Tech, and Financials, where longs were dumped and shorts added. In contrast, staples and energy stocks were rare bright spots, as hedge funds increased longs there expecting safety. Emerging markets were also sold off. This sector/regional rotation means that a future rally might favor the very assets now neglected – a mirror image of today’s pain. The scale of this purge has set off classic capitulation alarms. Goldman reports that short positions in European macro stocks hit 11% of total exposure – a 10-year high. In plain language, funds are betting record amounts that European stocks will fall. In the U.S., the six-week cumulative net selling is now among the largest in a decade, approaching levels last seen during the Covid crash. Such extremes suggest most weak longs are gone – a typical “exhaustion” state. When hedge funds as a group move to all-short or massively underweight, history says the downside may be limited. Indeed, previous episodes (March 2020, late 2018, etc.) saw similarly ominous positioning promptly followed by furious rebounds once selling pressure eased. It wasn’t just discretionary managers leaning out; systematic strategies have also been dumping risk. Trend-following CTAs and risk-parity funds de-leveraged as volatility surged, meaning automated models cut positions across stocks, bonds and commodities. While detailed stats are proprietary, Goldman notes that systemic selling by quant funds amplifies market moves. Put simply, as markets fell, algorithms sold to stop losses, reinforcing the cycle. The result: even normally “anticorrelated” strategies like trend CTAs were net sellers, not buyers, of equities. This mechanical deleveraging has compounded the chaos – and it often ends suddenly when models hit limits. Every panic has a mirror. Goldman explicitly notes today’s net-selling is approaching the depth of March–April 202 (Covid lockdown) and even the Oct 2018 sell-off, though still shy of last June. In those analogs, markets snapped back dramatically. For example, after the March 2020 trough, the S&P 500 rebounded 35% in just weeks once buyers returned. Similarly, the 2011 European crisis saw a 20% bounce when fears eased. The pattern is clear: when herd psychology shifts from extreme fear to cautious optimism, short-covering and bargain-hunting can quickly drive a powerful rally. Caution is still warranted. Historically, the first bounce after extreme selling can be a bull trap. If war tensions remain high or news disappoints, today’s buyers may find their gains evaporating. For instance, markets briefly rallied on rumors of peace talks last June before falling back. Goldman and other analysts note that “the first peace rally reverses fastest” in past crises. In other words, traders who rush in on the first green candle can get stuck when shorts reassert control. The advice: let any rally prove itself (e.g. sustained volume, break of key resistance) before committing fully. The worst outcome would be buying at the top of a relief rally that falters, requiring another round of selling.
johneb492254456
 Goldman’s traders warn that all this gloom sets the stage for a “violent” rebound if even a partial peace emerges. With so many positions bets on a crash, any hint of de-escalation could trigger a short squeeze. Bloomberg highlights that “heavy short sales by hedge funds and disposals by systematic investors have increased the potential for a sharp swing higher” if conflict news turns positive. In practice, this means that a minor ceasefire announcement or diplomatic breakthrough might send buying algorithms and short-covering flows into overdrive. Investors should prepare for swings: the initial rally could be steep and fast, potentially overshooting as stop-losses trigger more buys.
The Paradox Nation: Why Africa's Biggest Oil Producer Cannot Fuel Its Own People
April 1, 2026 by johneb492254456 Nigeria produces Africa’s most oil, about 1.6–1.7 million barrels per day in 2025, yet it still struggles to keep fuel flowing to its own citizens. The country exports crude while importing refined petrol, a disconnect that became glaring with the 2023 opening of Dangote’s massive refinery. Despite this new capacity, Nigeria spent roughly $10 billion on gasoline imports in 2025. In practice, even Africa’s largest oil economy “cannot refine enough to meet its own needs,” as one analysis puts it. Nigeria now buys much of the petrol its citizens need, even as it sells the crude oil it produces. The core of the paradox is that access to oil does not equal access to fuel. Top executives like Aliko Dangote have warned that Nigeria’s reliance on imported refined products leaves it vulnerable to global shocks. On paper, Nigeria has significant refining capacity. Its oil fields produce about 1.63 million barrels per day, making it Africa’s top producer. However, domestic refining is concentrated in the new Dangote refinery (650,000 barrels/day) and a trio of state-owned plants (Port Harcourt, Warri, Kaduna) that together have 445,000 barrels/day capacity. Crucially, all three state refineries are effectively offline today. Dangote’s plant in Lagos is the world’s largest single-train refinery (650,000 bpd), but it only began feeding Nigeria’s market in late 2023. The legacy refineries built in the 1970s have long suffered from neglect. Official reports in 2026 confirm that Port Harcourt, Warri, and Kaduna produced virtually zero petrol in recent months. In effect, Nigeria has “capacity” it can’t use, and lacks the operational refining needed to turn most of its oil into fuel for Nigerians. Why can’t Nigeria’s oil refine itself into fuel? The roots are institutional as much as technical. The three state-owned refineries remain idle for want of investment and maintenance. Government data show no petrol output from Port Harcourt, Warri or Kaduna in recent months. The pipelines and equipment sat unused while fuel imports continued. Earlier attempts to jump-start local refining have stumbled. In late 2023, President Tinubu announced a 15% fuel import tariff to spur local supply, but it was swiftly cancelled when it became clear domestic production was insufficient This paradox carries a heavy economic cost. In 2025 Nigeria exported roughly $31.5 billion in crude oil revenues, but spent about $10 billion on fuel imports. That means roughly one-third of oil export earnings were offset by buying back petrol at world prices. Put differently, each barrel of crude sold abroad is nearly half a barrel’s worth of expensive imported gasoline. This mismatch pressures Nigeria’s balance of payments and currency. Even as the current account remained positive thanks to high oil prices, reliance on imports leaves the naira vulnerable to swings in global markets. It also burdens consumers: fuel that should be “owned” by Nigerians instead drains foreign reserves. For ordinary Nigerians, the fuel paradox means volatility at the pump and in power supply. As global oil prices surged in 2025–2026, local petrol prices climbed sharply, adding to Nigeria’s stubborn inflation. Small businesses and transporters – who rely on petrol and diesel generators – have started passing higher fuel costs onto consumers, driving up food and commuter prices. Aliko Dangote has been blunt about the risks: he warned that continued Middle East tensions and higher oil prices could spur another wave of inflation across Africa. He even mentioned that governments might be forced into emergency measures – such as encouraging remote work or shortened hours – to curb fuel demand, echoing pandemic-era policies. Solving Nigeria’s fuel paradox requires tough choices. The government has signaled steps to revive the state refineries. In early 2026 NNPC announced plans to seek partners to rebuild Port Harcourt, Warri and Kaduna – restoring a combined 445,000 bpd capacity. It’s also planning a 10,000 bpd condensate plant in Edo State. But analysts caution that policy must align. A recent CBN report notes Nigeria imported “N5.7 trillion” of crude in 2025 despite a policy to swap local oil for foreign exchange. In practice, Dangote and modular refineries still import the majority of feedstock. Critics say the naira-for-crude scheme has “yielded minimal results” so far. Until reforms ensure that Nigeria’s own oil flows into its refineries (not off to the highest bidder abroad), the cycle will repeat. In conclusion, Nigeria’s paradox is not a natural law but a policy failure. The country has the resources to fuel its economy, but needs coordinated investments and market reforms to unlock them. Only then can Africa’s top oil nation stop “buying the petrol it cannot afford” and actually use the oil it produces.
johneb492254456
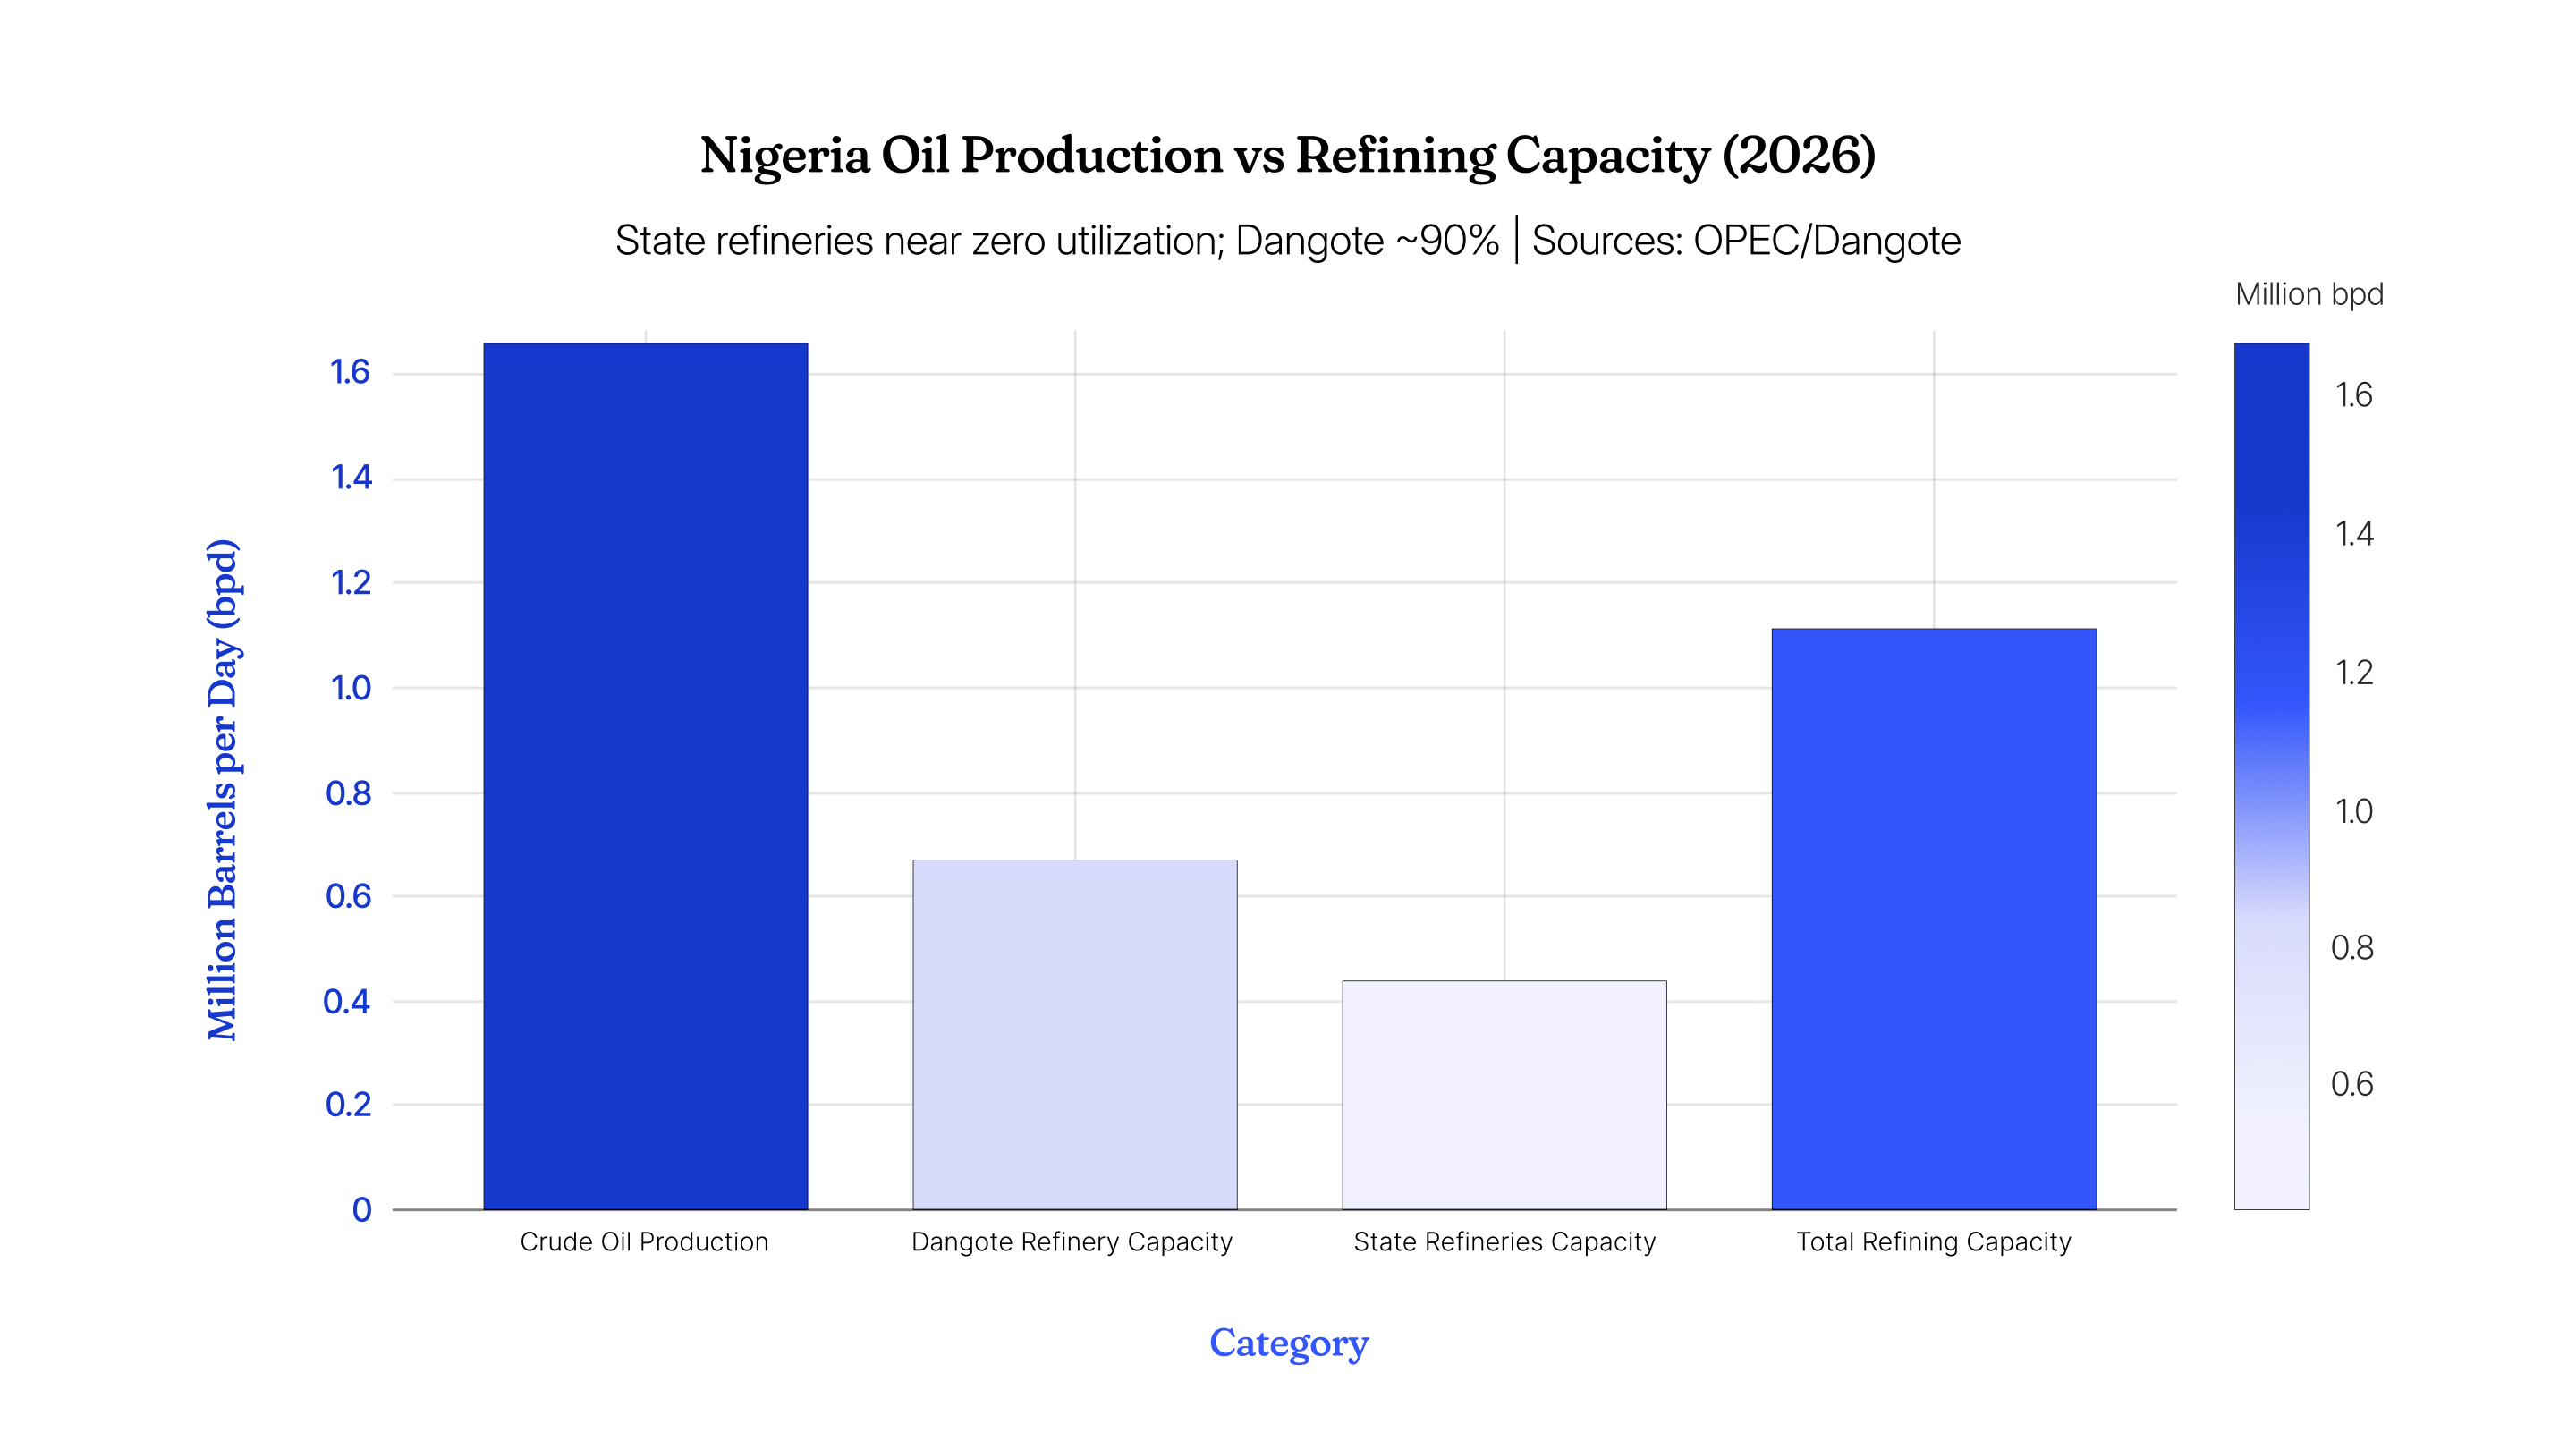 Even so, Nigeria’s total petrol consumption exceeds 50 million liters per day. BusinessDay data for early 2026 shows Dangote’s output covering around 36–40 million liters/day, while overall supply (including any local and import) was still roughly 50–60 million L/day. In other words, Dangote meets only about 40–50% of demand at best. The rest continues to come from imports. Industry reports estimate that over 60% of Nigeria’s gasoline consumption in 2025 was imported fuel. That means despite Dangote’s scale, Nigerians continue to queue for petrol as if the country were a net importer. This is the essence of the paradox: an oil boom has arrived, yet the pump still looks to overseas.

Knowledge Is Everywhere — Insight Is Now the Rare Asset
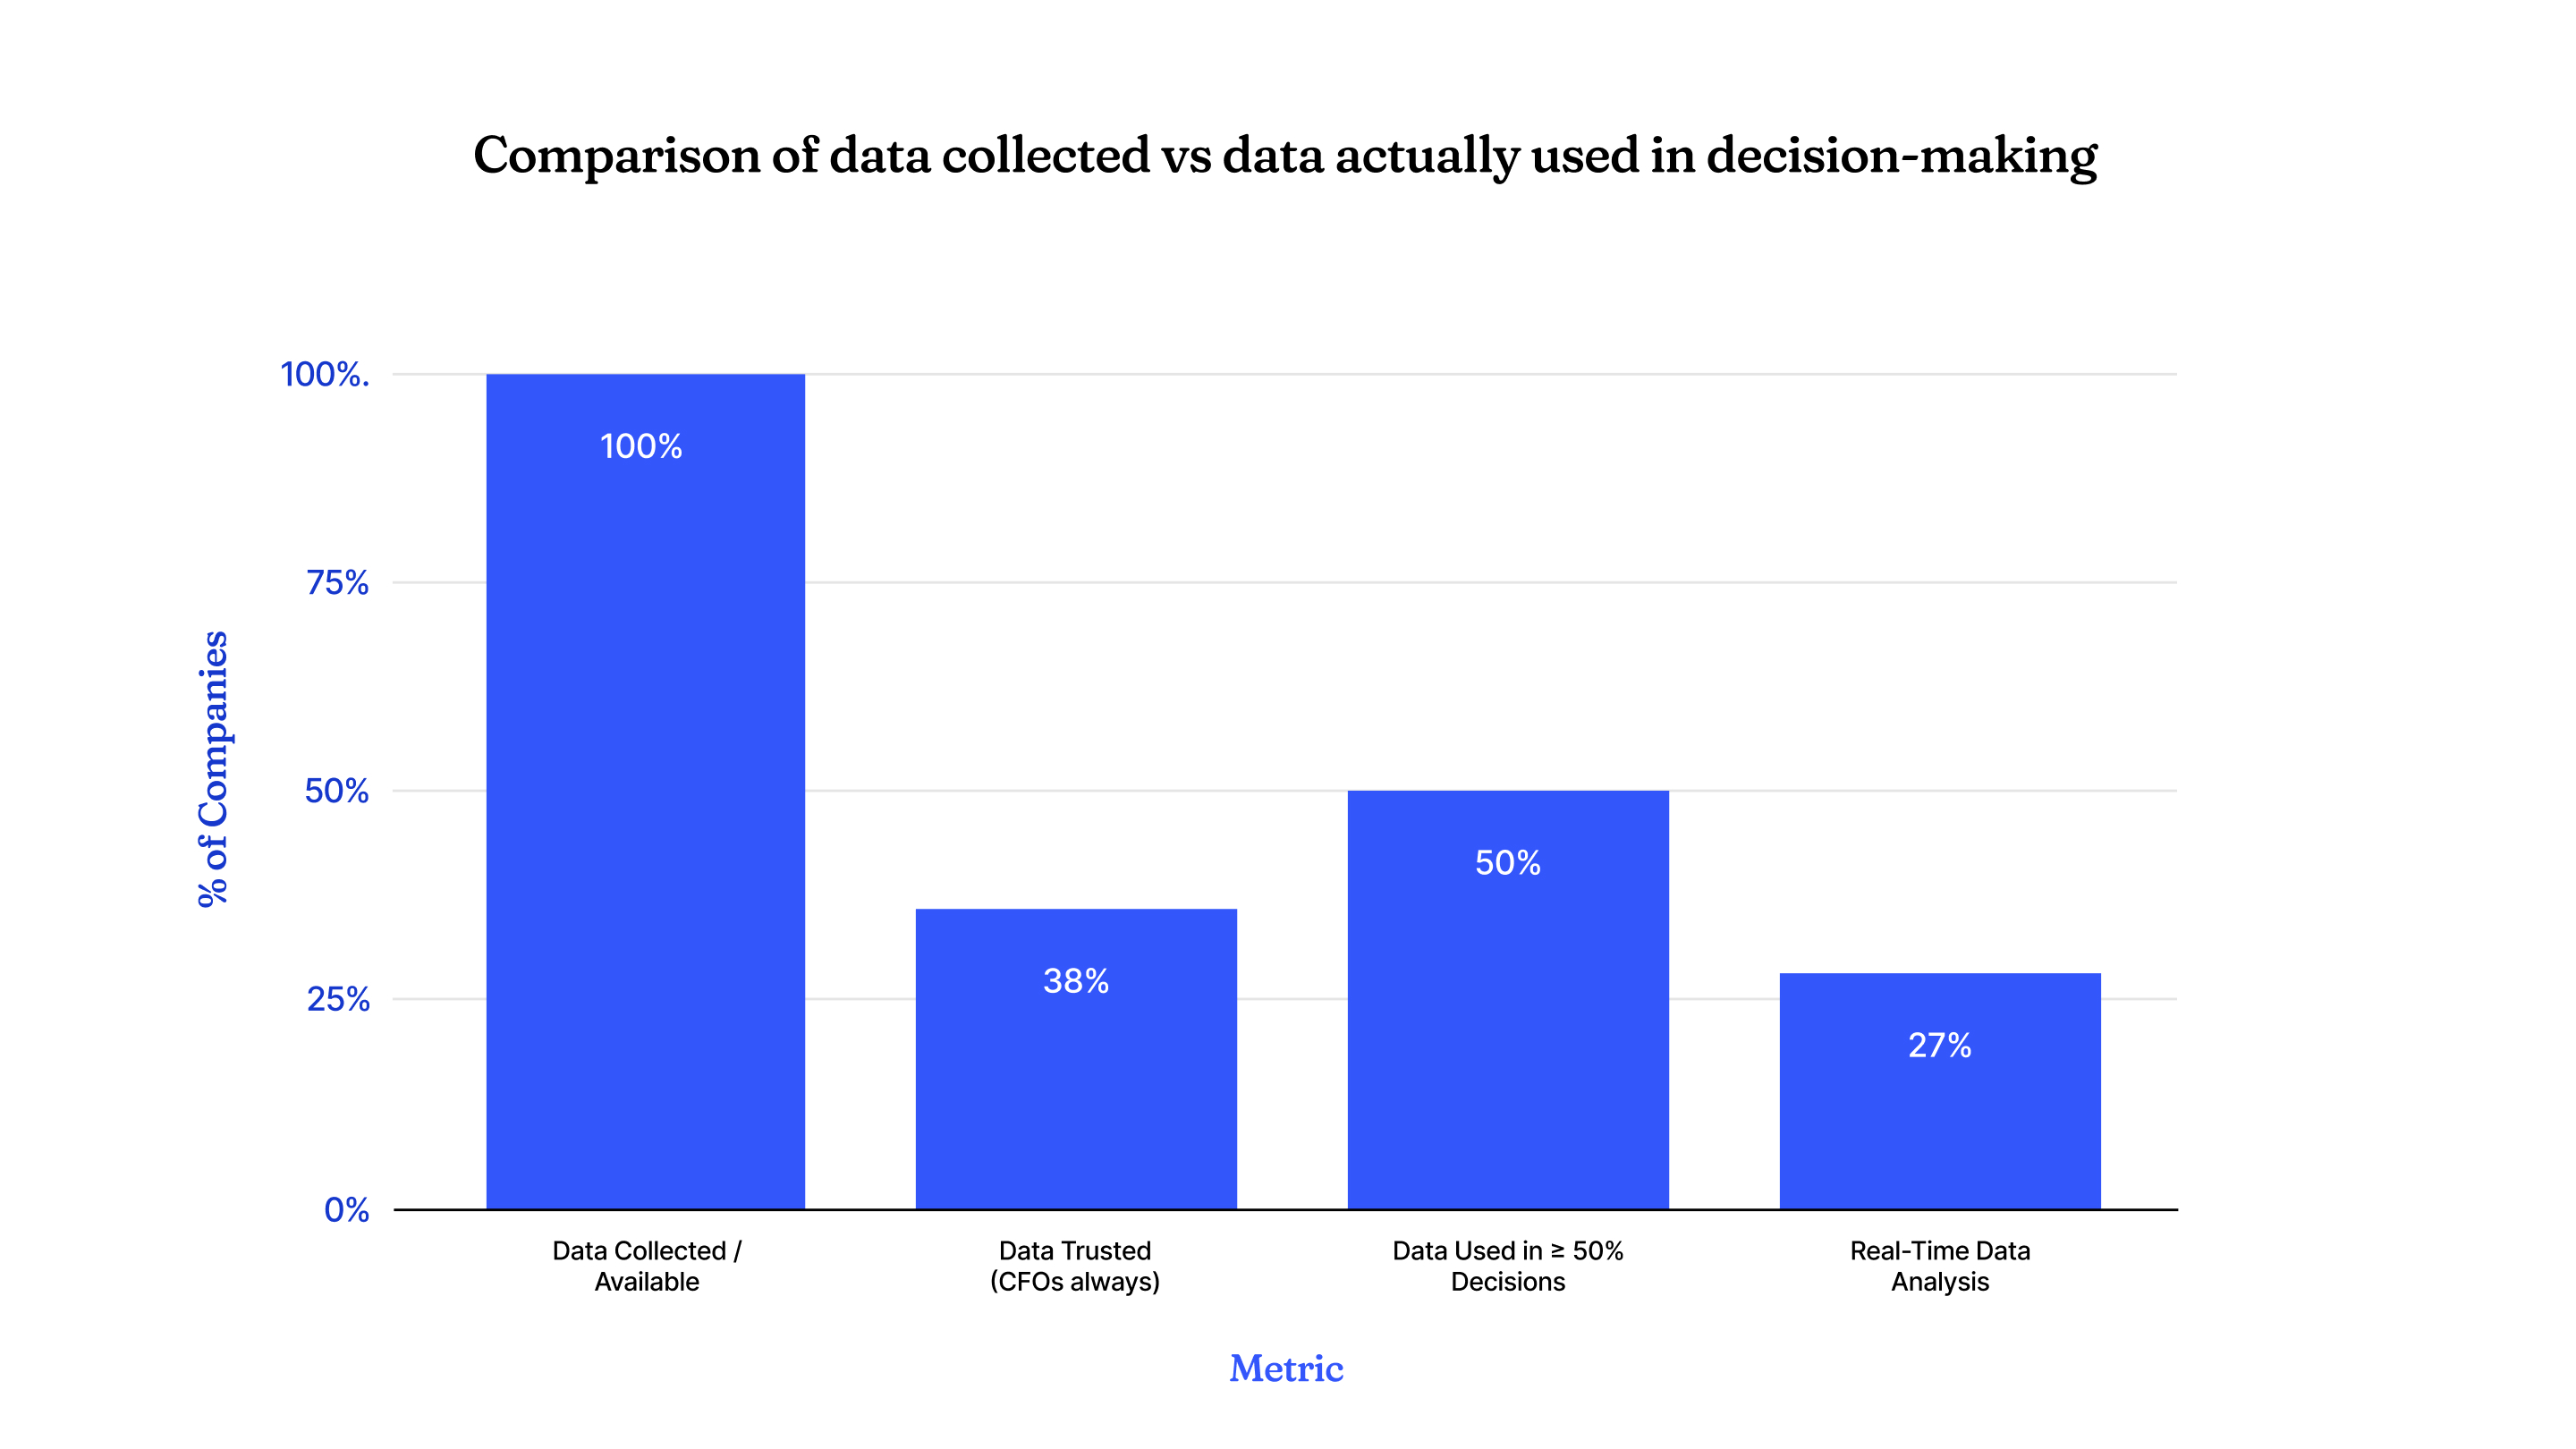
March 25, 2026 by johneb492254456 In the digital age, the barrier to information has effectively collapsed. Over the last two decades, connectivity has spread globally (well over half the world’s population now uses the internet), and devices constantly generate real-time news, social feeds, market data, and analytics. In other words, raw knowledge is omnipresent, and simply having data is no longer a source of advantage. Instead, organizations that convert this relentless flood of information into contextualized insight set themselves apart. Insight – the ability to filter noise and draw actionable conclusions – is the scarce asset today. As digital tools have proliferated, decision-makers now face a “Niagara Falls” of data rather than scarcity. Roughly two-thirds of adults worldwide use the internet and smartphones to tap into news, social media and financial information on demand. While this democratizes knowledge, it also creates paradox: more data can paralyze rather than clarify. A finance industry executive observes that this abundance “results in an overwhelming amount of material to sift through”. Organizations now drown in streams of statistics and alerts, making it hard to identify what truly matters. The new challenge is not finding information but distilling it: separating signal from noise so that only relevant, trustworthy insights reach decision-makers. In financial markets, the data tsunami is especially acute. Every minute brings fresh price ticks, earnings updates, tweets, and analyst reports. Yet investors often struggle to synthesize these into foresight. Market observers note that heightened volatility and nonstop data flows have compressed decision cycles and amplified short-term noise. For example, after a U.S. government shutdown delayed key economic releases, Fed Chair Jerome Powell likened the situation to “driving in the fog” – even abundant past data couldn’t guide policy without fresh signals. In practice, traders and portfolio managers increasingly gamble on how data are interpreted rather than on new numbers themselves. Short-term market swings now often reflect competing narratives and speculation, underscoring that interpretation is the real currency. Companies today collect mountains of data – from sales figures and supply chains to customer feedback and ESG metrics – but translating it into strategy remains tough. In practice, many firms underutilize their own data. A global CFO survey found that only about 38% of finance leaders said they always trust their data, and barely half report making even half of their decisions based on data. This trust gap means insights often fall through the cracks. Leading firms, however, set themselves apart by aligning executives around clear goals and tracking the right signals. McKinsey reports that companies in the top quintile of growth were 2.5 times more likely than others to fully align on their competitive advantages and to monitor those advantages at the market level. Across regions, data abundance varies, but the need for insight is universal. Emerging economies have made remarkable strides: for instance, digital transactions (mobile money and banking apps) in Africa and Asia have surged. Yet richer access has not automatically translated to smarter decisions: countries and firms alike struggle to analyze data strategically. Even as emerging markets leapfrog with technology, they face similar challenges of turning data into policy and business insight. In mature markets, fragmented news and policy shifts also create noise. In all contexts, the competitive winners will be those who invest in extracting clarity – for example, through better analytics teams and governance frameworks that turn raw data into targeted knowledge. In summary, raw knowledge is now ubiquitous – but meaningful insight remains rare. This shifts the competitive moat from data ownership to insight capability. Across finance, industry, and tech, the leaders will be those who can swiftly distill accurate intelligence from complexity and execute boldly. McKinsey’s research underscores this point: companies that explicitly track their unique advantage and relevant signals are far more likely to outperform peers. Likewise, experts emphasize that success in the digital era comes from converting inputs into decisions that customers can feel. As one industry analyst put it, firms must choose to “convert inputs into decisions” rather than just “feed the machine” with data. Moving beyond information overload to genuine insight – through skilled people, disciplined processes, and smart use of AI – will be the rare asset that drives outcomes in the years ahead.
johneb492254456

 Emerging technologies have accelerated the knowledge glut. AI tools and FinTech platforms generate analysis and recommendations at scale, making advanced outputs widely available. For example, IMF data show that digital financial services usage has exploded – mobile and online transactions per person have grown roughly fivefold in emerging markets since 2017. Similarly, a recent McKinsey survey finds 88% of organizations report using AI in at least one function. However, most are still in pilot mode: only about 39% report significant enterprise-level impact on productivity or profits. This gap highlights the scarcity of insight, not raw output. Widespread algorithmic signals are now table stakes; the premium belongs to those who critically vet and strategically apply AI/FinTech outputs. Without human judgment and context, even the best AI forecasts or big data models can mislead.

Why the Ghanaian cedi broke every rule and what the data says happens next
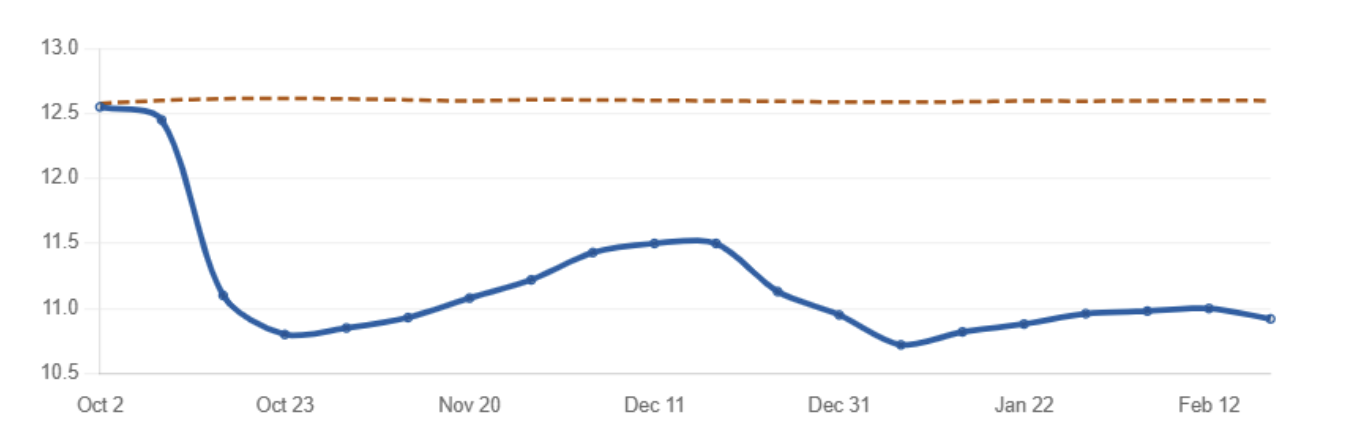
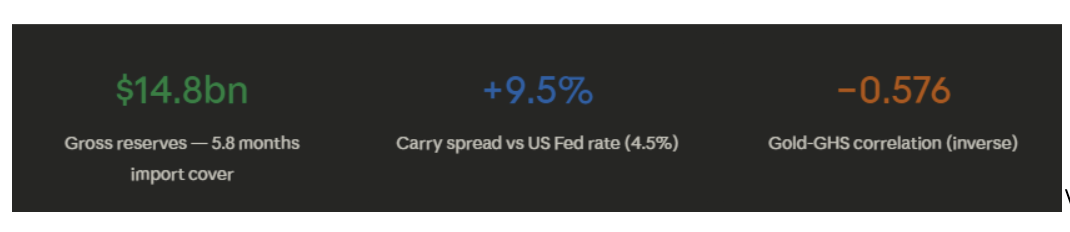
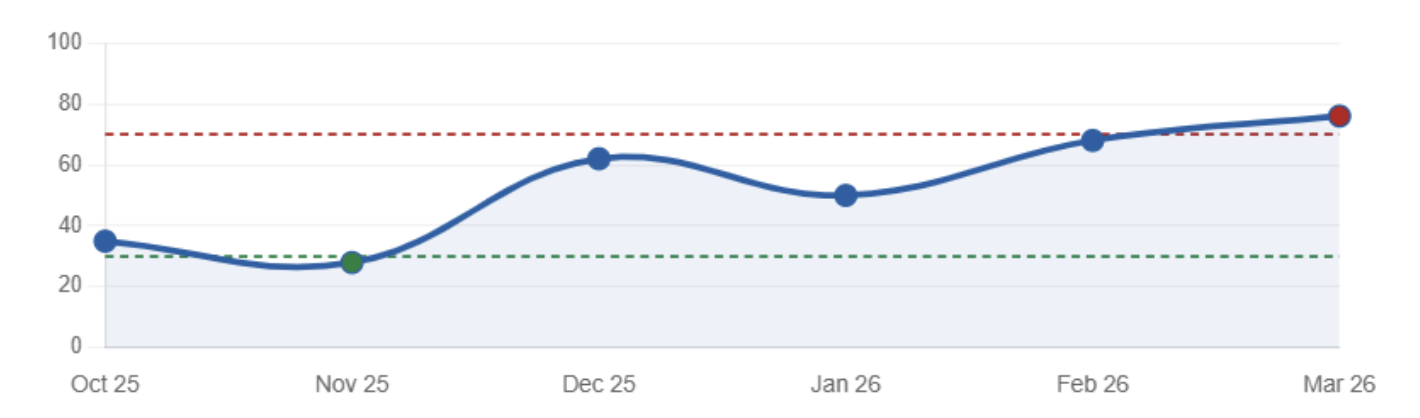
March 23, 2026 by johneb492254456 There is a moment in currency analysis that every trader dreads, when the market does the opposite of what textbook economics says it should. In September 2025, the Bank of Ghana cut its benchmark interest rate by 350 basis points. Every financial model in the room said the cedi should have weakened. Instead, it strengthened by roughly 14 percent over the following four weeks. No crash, no panic, just a cedi that simply refused to follow the script. That anomaly is where this story begins. Standard monetary theory is clear on this point. When a central bank cuts interest rates, the yield on domestic assets falls, making them less attractive to international investors. Capital flows out. The currency depreciates. It is one of the most reliable relationships in all of economics. Ghana broke it. To understand why, you need to look beyond the rate decision itself and understand the context it sat inside. By September 2025, Ghana had navigated one of the most dramatic economic recoveries any African economy has managed in recent memory. Inflation had been running at 23 percent. The cedi had traded as weak as 16.40 to the dollar at its November 2024 low. The IMF program was in place, debt restructuring was proceeding, and the numbers were moving in the right direction for the first time in years. When the Bank of Ghana cut rates by 350 basis points, the market did not hear that yields were falling. It heard something much more important: Ghana has fixed its economy. The re-rating of sovereign credibility overwhelmed the mechanics of any yield calculation. The international capital did not flee, it returned. The cedi did not weaken, it surged. We ran a formal event study across all four rate cuts in the cycle and the result is unambiguous. “The market did not hear that yields were falling. It heard that Ghana had fixed its economy.” The BoG did not stop in September. Between then and March 2026, the Monetary Policy Committee cut rates three more times, eventually bringing the policy rate from 25 percent all the way down to 14 percent; a total reduction of 1,100 basis points in six months. Each successive cut told a progressively different story. Cut 2 in November 2025, another 350 basis point move, produced the textbook response. The cedi weakened approximately 3.8 percent over four weeks. Standard. Expected. The credibility premium from Cut 1 had already been priced in. Cuts 3 and 4 told the most revealing story of all; the depreciation per basis point fell dramatically with each successive cut. What you are seeing in those numbers is textbook diminishing returns, the market has been so thoroughly priced in the easing cycle that each additional cut generates progressively less reaction. By the time Cut 4 arrived on March 18, the cedi had already moved before the MPC even announced. The pre-positioning window compressed from three weeks before Cut 1 to a single week before Cut 4. The question every treasury desk and corporate client is asking right now is whether 10.92 cedis to the dollar represents an attractive rate to convert or whether further weakness is coming. The answer requires a fundamental anchor, and the one that matters most is the Purchasing Power Parity model. PPP is simple in concept: over time, exchange rates should reflect the difference in inflation rates between two countries. Ghana’s inflation has collapsed from 23 percent to 3.3 percent while the United States runs at approximately 2 percent. The calculation places the current PPP fair value of USD/GHS at approximately 11.25. The dollar today is mildly overvalued by roughly 3 percent relative to PPP fair value. This is a critical finding because it reframes the depreciation narrative entirely. The cedi is not in crisis, it is correcting toward economic reality after a period of overvaluation in late 2025. This same framework explains the Databank research house year-end 2026 forecast of 12.85. At that rate, accounting for the cumulative inflation differential between Ghana and the US across a full year, the dollar would reach its long-run PPP equilibrium. It is not a collapse forecast. It is a mean-reversion forecast. Despite the ongoing easing cycle, three structural factors prevent the cedi from experiencing the kind of disorderly depreciation that characterised 2022 to 2024. The reserves position alone is formidable. At 5.8 months of import cover, nearly double the IMF minimum of 3 months, the Bank of Ghana has the ammunition to defend the currency if it chooses to. Even a stress test assuming a 20 percent oil price shock reduces cover only to 5.1 months. Still well above critical levels. The carry trade is equally important. At 14 percent BoG rate versus 4.5 percent in the United States, Ghana offers roughly 950 basis points of carry spread. With cedi depreciation running at approximately 5 to 6 percent annually, net carry remains positive at 3.5 to 4.5 percent. That positive carry creates a natural floor. Gold rounds out the structural picture. Ghana is Africa’s largest gold producer, and the Gold Board generates approximately 750 million dollars of monthly FX inflows. A regression of gold prices against USD/GHS produces a Pearson correlation of negative 0.576; when gold rallies, the cedi typically strengthens. With gold above 1,950 dollars and geopolitical tensions keeping it elevated, this structural inflow provides meaningful cedi support even as rates fall. Fig. 6 — Gold price regression model. When actual USD/GHS diverges above the gold-implied value by more than 0.3, it signals the dollar is overvalued relative to Ghana’s export fundamentals. What every treasurer needs to know before May The next Bank of Ghana MPC meeting is scheduled for May 18 to 20. Based on the lead-lag pattern documented across all four cuts, the market will begin positioning approximately one week in advance around May 11. Any treasurer or corporate FX manager with dollar requirements in May needs to be aware that the optimal conversion window is before the market front-runs the cut, not after. The composite Cedi Sentiment Score, a proprietary index combining six independent technical indicators into a single 0-to-100 signal, currently reads 76. Above 70 is the confirmed bearish threshold for the cedi. Fig. 7 — Cedi Sentiment Score progression. The score of 76 in March 2026 is the highest in the series, representing unanimous alignment across all six indicator components. The score has never been higher across the six months of this analysis. Every component — trend strength, momentum, positioning, volatility regime; is aligned in the same direction. The direction is clear. The pace will be measured. The carry still provides a floor. But 10.92 today will, in all probability, look like an attractive rate by December.
johneb492254456
The rate cut that defied everything

Four cuts, four completely different markets


Is the cedi actually cheap right now?
The three structural anchors protecting the cedi

An Analysis of the International Energy Agency’s Proposed 400-Million-Barrel Release and Its Implications for Oil Market Confidence
The International Energy Agency (IEA) has proposed a massive 400-million-barrel release from strategic petroleum reserves (SPR), the largest in its history, amid surging oil prices from Middle East conflicts. This move aims to restore market confidence shaken by supply disruptions
Proposal Background
The IEA, coordinating for 32 OECD member nations, recommended releasing 300-400 million barrels during emergency consultations on March 10-11, 2026. Triggered by the U.S.-Israel war with Iran, which closed the Strait of Hormuz—handling 20 million barrels per day (bpd), the plan addresses trapped Gulf supplies of nearly 15 million bpd crude plus 4 million bpd refined products. A decision was expected on March 11 at 1300 GMT, advancing if no objections arise.
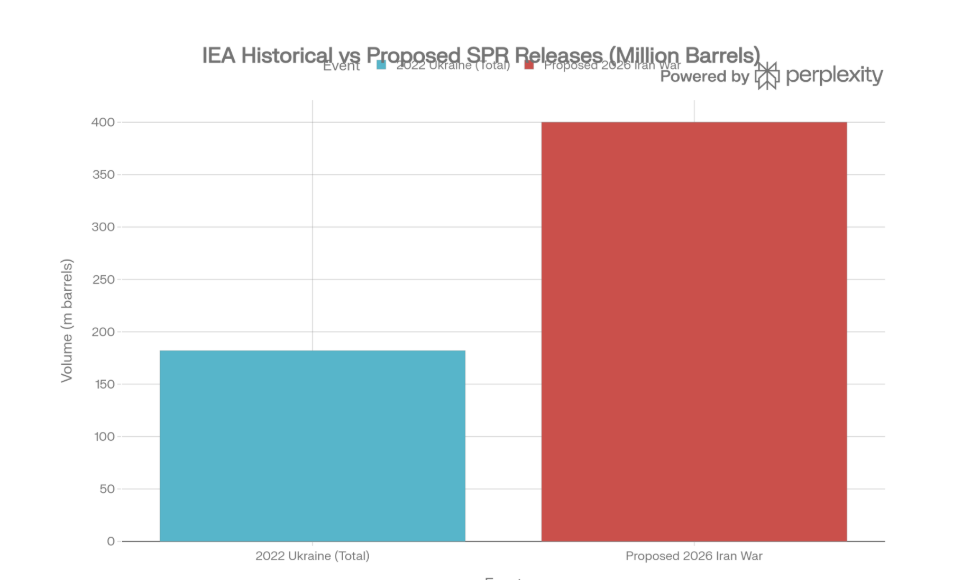
This dwarfs the 2022 record of 182 million barrels released post-Russia's Ukraine invasion (60 million in March, 122 million in April). Representing 25-33% of IEA's 1.2 billion-barrel emergency stocks, approval would signal unified action against price spikes.
 Current Market Crisis
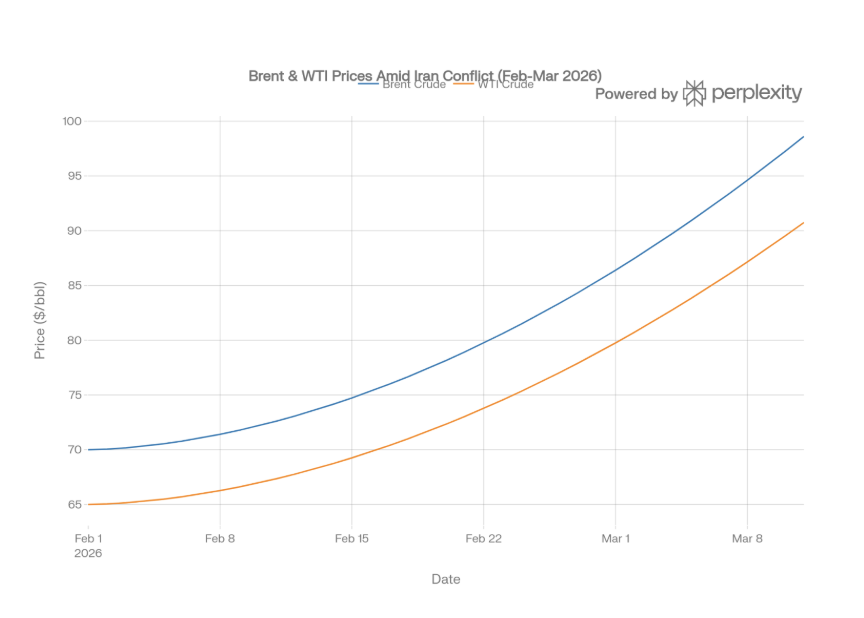
Oil prices have skyrocketed since late February 2026, with Brent surging 42% from January lows to $92.62 and WTI to $90.72 by March 6 amid Hormuz fears. Volatility peaked near $120 briefly on March 9, driven by attacks on tankers and reduced Strait transits (only nine ships since early March). Iraq and Kuwait output risks halting, potentially losing 4.7 million bpd.
Forecasts adjusted sharply: Goldman Sachs raised Q2 Brent to $76 (from prior), UBS Q1 to $71, averaging $72 yearly. Pre-war, surpluses were expected; now, acute shortages loom without intervention.
 Historical Precedents
IEA SPR releases have proven effective historically. The 2022 effort stabilized markets post-Ukraine shock, though exact price drops varied. Simulations show 1991 and 2011 releases lowered prices 15-20% temporarily and eased backwardation by 5 points. A 10-million-barrel draw can cut prices 2-3% short-term.
No release exceeded 182 million barrels until this proposal, which could double that impact given the scale. Past actions boosted confidence by signaling supply commitment, often more than physical volumes.
 Expected Market Impacts
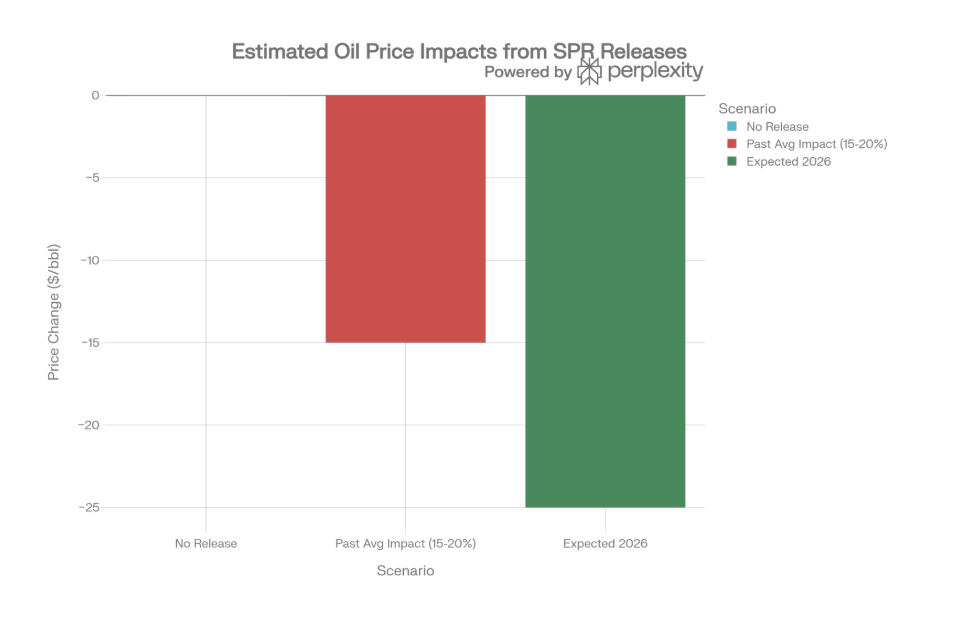
The 400-million-barrel release, equivalent to two months of Saudi output, could flood markets, potentially dropping Brent/WTI 20-30% from peaks, exceeding historical 15-20%. At current ~$92 Brent, this implies $15-25/bbl relief, curbing inflation in oil-importing nations.
Short-term: Prices dip as bids compete for cheap SPR oil. Medium-term: Restores confidence, narrows futures-spot spreads. However, experts warn it may not fully offset the 20 million bpd Hormuz loss if conflict persists. Nigeria, with the Naira tied to oil, could see forex relief.
Implications for Confidence
SPR releases signal resolve, often amplifying effects psychologically. This record scale could reset panic premiums, vital as prices hit 2026 highs. Yet, Hormuz closure traps regional oil, limiting global flows; full efficacy needs war de-escalation.
For emerging markets like Nigeria (top IEA African member indirectly), cheaper oil eases import bills, supports Brent-linked budgets. [context] Investor sentiment may shift from fear to caution, narrowing contango.
Broader Economic Ramifications
Globally, lower oil curbs inflation (e.g., U.S. CPI sensitivity). [inferred from spikes] OPEC+ might cut output less aggressively, balancing supply. Energy transitions accelerate as volatility highlights vulnerabilities.
Risks include diluted SPR reserves for future crises and geopolitical backlash if seen as anti-Iran. Success hinges on execution speed, past releases took weeks.
Risks and Limitations
Physical challenges: Auctioning/storing/distributing 400 million barrels strains logistics. If Hormuz stays shut, the added supply can't reach Asia fully. Market skepticism could mute impact, as in partial 2022 rebounds.
Outlook and Conclusion
If approved, the release offers near-term relief, potentially stabilizing prices below $70 by Q2. Monitors watch IEA announcement outcomes and Hormuz flows. For analysts, this underscores SPRs as confidence tools amid volatility.

The Most Dangerous Employee Today Is the One Who Doesn’t Use AI
March 18, 2026 by johneb492254456 The most dangerous employee today is the one who does not use AI, as productivity divergence emerges as the primary workplace risk in this era. While access to AI tools remains universal across organizations, the key differentiator lies in adoption and fluency, creating efficiency gaps that hinder team performance in research, coding, writing, analysis, and decision-making. This week’s StayWired presentation reveals why the biggest threat to teams and careers no longer comes from job loss alone but from the quiet gap growing between those who embrace AI and those who hesitate. The workplace risk has changed dramatically in just the past two years. While earlier technology waves rewarded access to tools, today’s AI is available to nearly everyone through free or low-cost platforms, yet only a fraction of people weave it deeply into their daily routines. McKinsey’s 2025 global survey shows that 88 percent of organizations now use AI in at least one function, but nearly two-thirds remain stuck in pilot mode rather than scaling it across teams. Employees themselves report high familiarity, with 94 percent comfortable using generative AI, yet leaders often underestimate this readiness and move too slowly. AI power users achieve dramatically higher outputs, with OpenAI’s enterprise report revealing a sixfold productivity gap between intensive users and others, as those handling multiple tasks like data analysis and coding save up to five times more time. McKinsey surveys show employees using generative AI for over 30% of their daily work, triple leadership estimates, underscoring underrecognized divides that amplify across teams. Enterprises that fully lean into AI are already seeing clear, everyday wins in both productivity and broader business results. According to OpenAI’s State of Enterprise AI report, which Bloomberg highlighted as one of the most comprehensive enterprise surveys to date, users save a solid 40 to 60 minutes every working day, giving them breathing room to take on more advanced work such as deeper data analysis and sophisticated coding that previously felt out of reach. Those extra minutes quickly add up to real momentum. Employees avoiding AI create widening team gaps, as evidenced by Gallup’s finding that workplace AI use nearly doubled to 19% by 2025, led by tech and finance sectors, yet strategy lags at 22% of organizations. IMF projections indicate 40% of global jobs face AI transformation, demanding skill shifts where half of workers lack training support by 2030. This refusal risks obsolescence, mirroring how non-spreadsheet users became bottlenecks decades ago.
johneb492254456

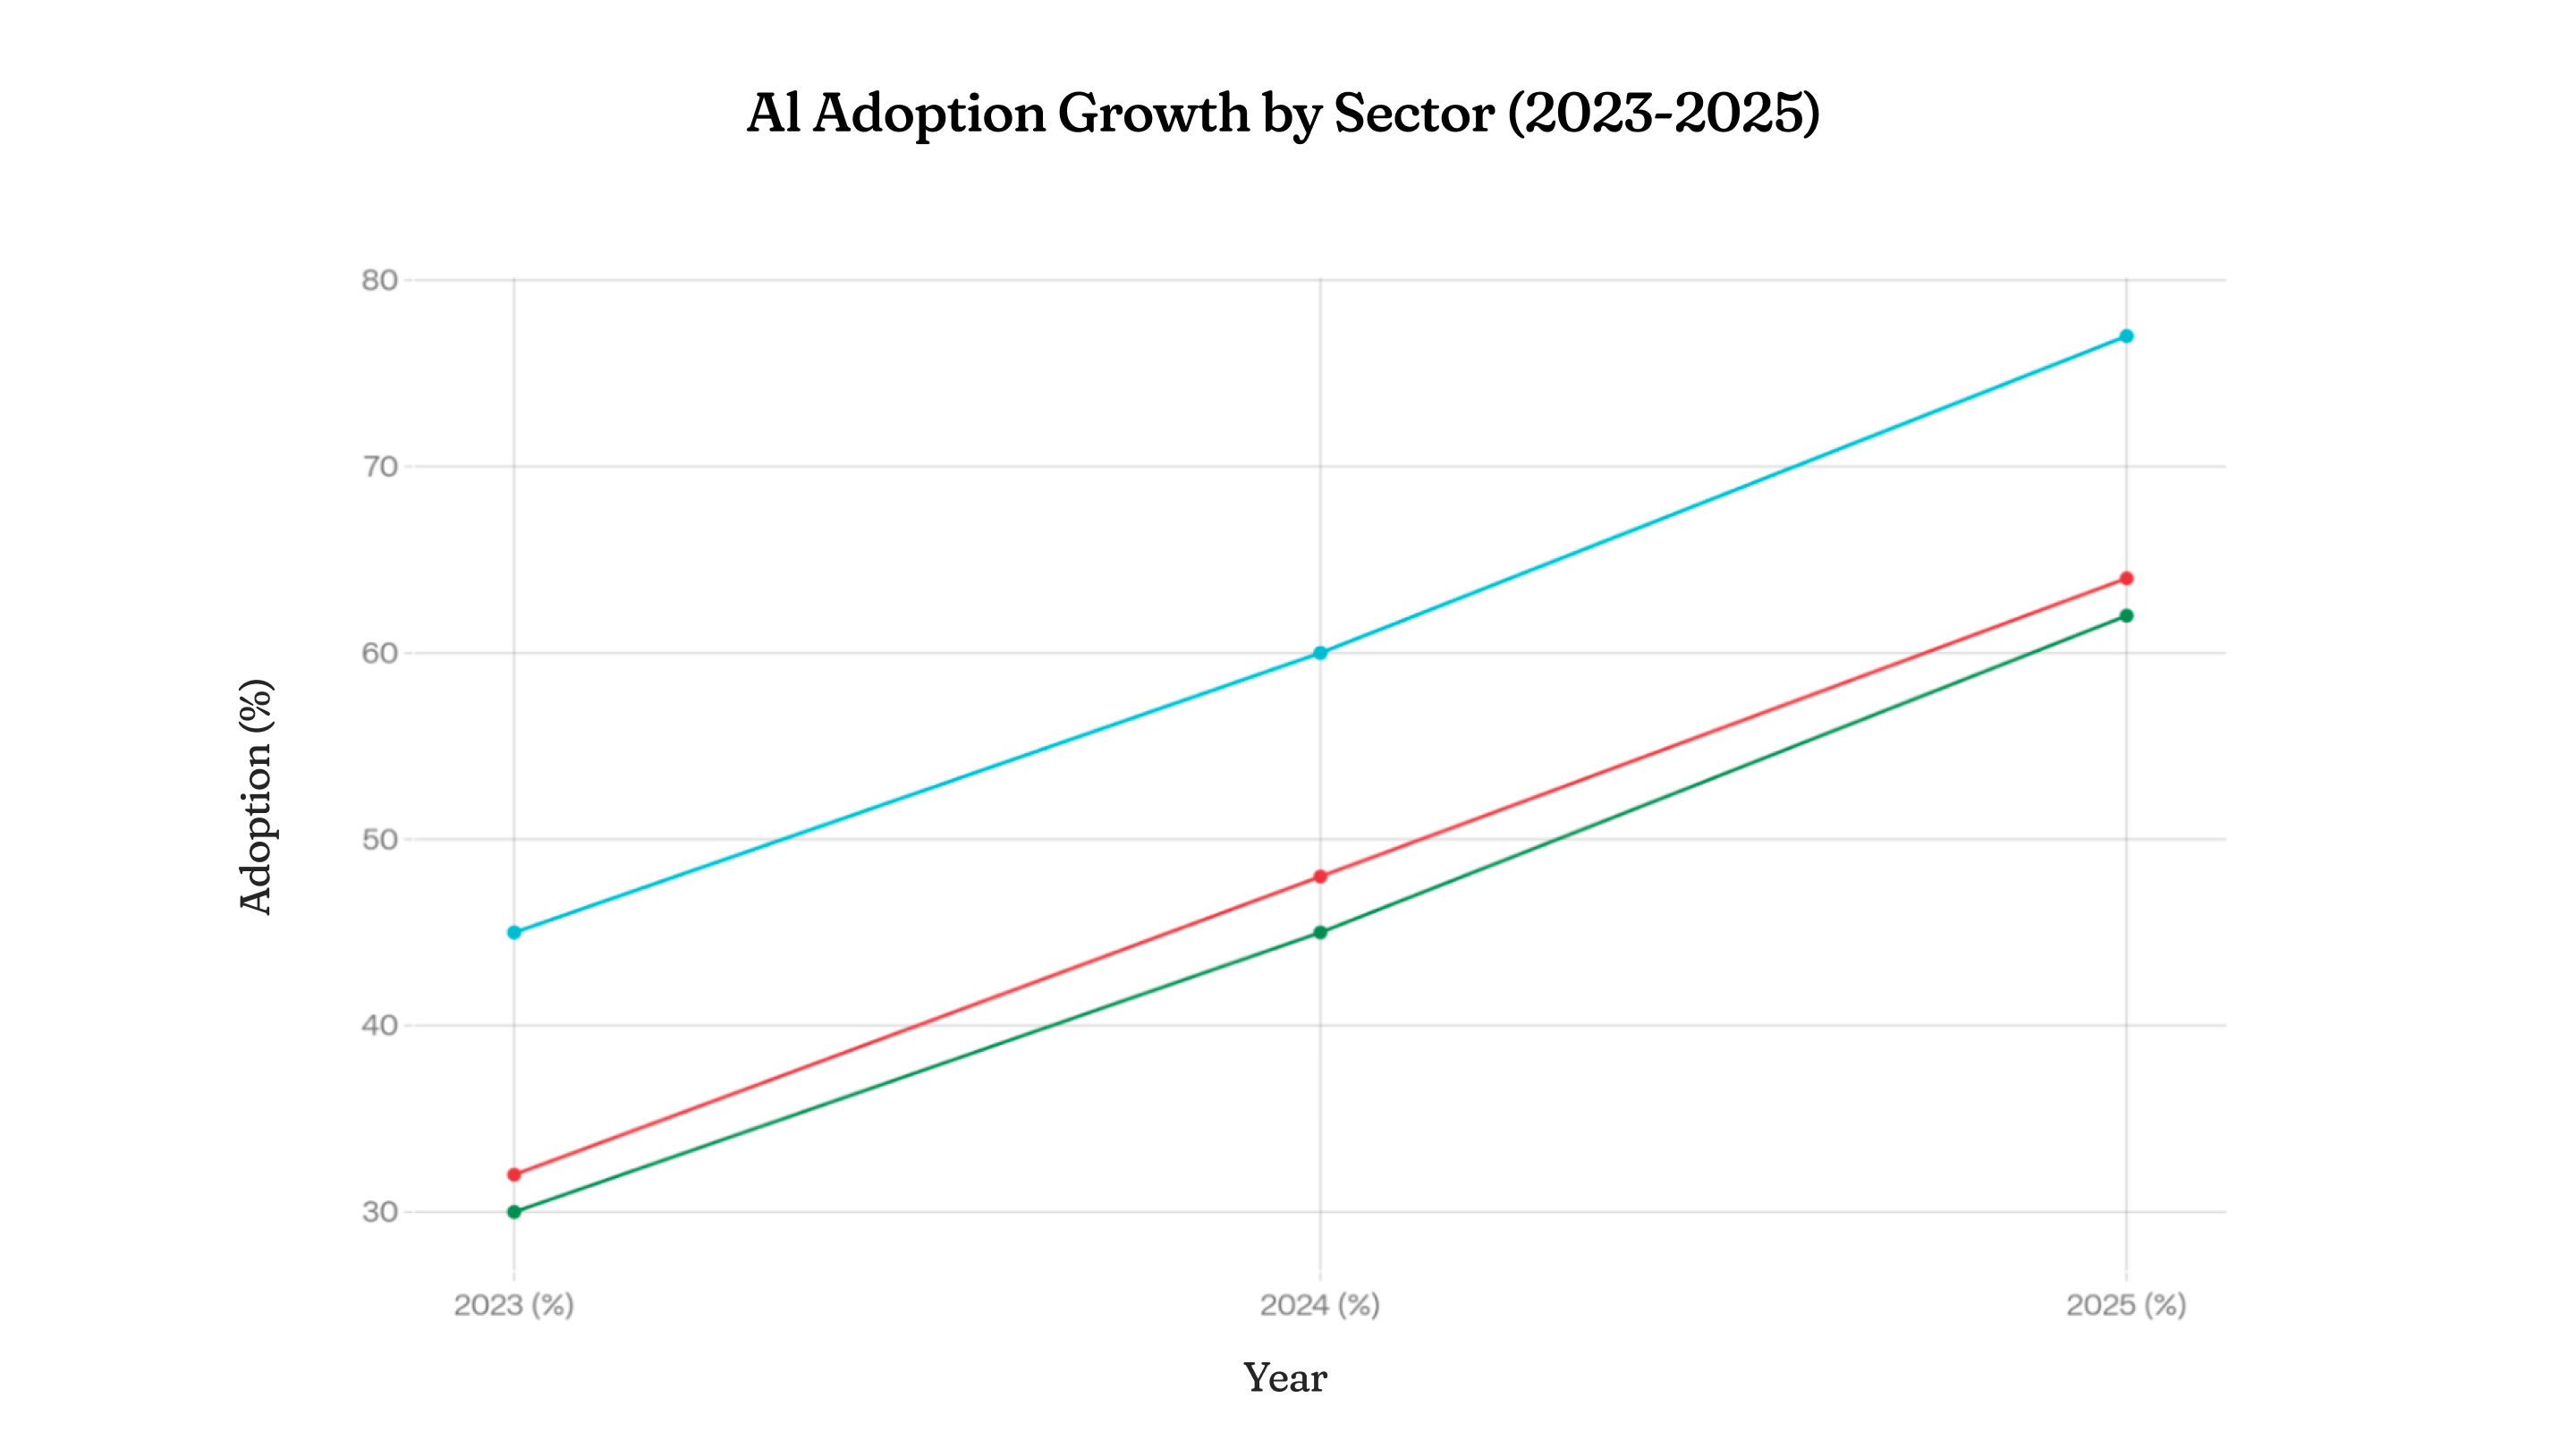 Building AI fluency starts with small, consistent habits that anyone can adopt right now. Begin by choosing one daily task, such as drafting emails, analyzing spreadsheets, or researching ideas and experiment with a reliable tool for just fifteen minutes each day. Seek out free resources and simple prompts to build confidence, as McKinsey notes that employees are far more ready than many leaders realize. Advocate for team training sessions and workflow redesigns that integrate AI safely, addressing the top concerns around privacy and accuracy highlighted in surveys. Track your own time savings and share wins with colleagues to normalize adoption and close internal gaps. Organizations that follow this path, according to the latest reports, move from experimentation to scaled value faster and avoid the productivity divergence that threatens laggards. The future belongs to teams where every member uses AI intelligently, turning potential risk into collective strength and ensuring no one gets left behind in the AI era.

The $100 Oil Question: Can the Middle East Tension Trigger the Next Inflation Wave
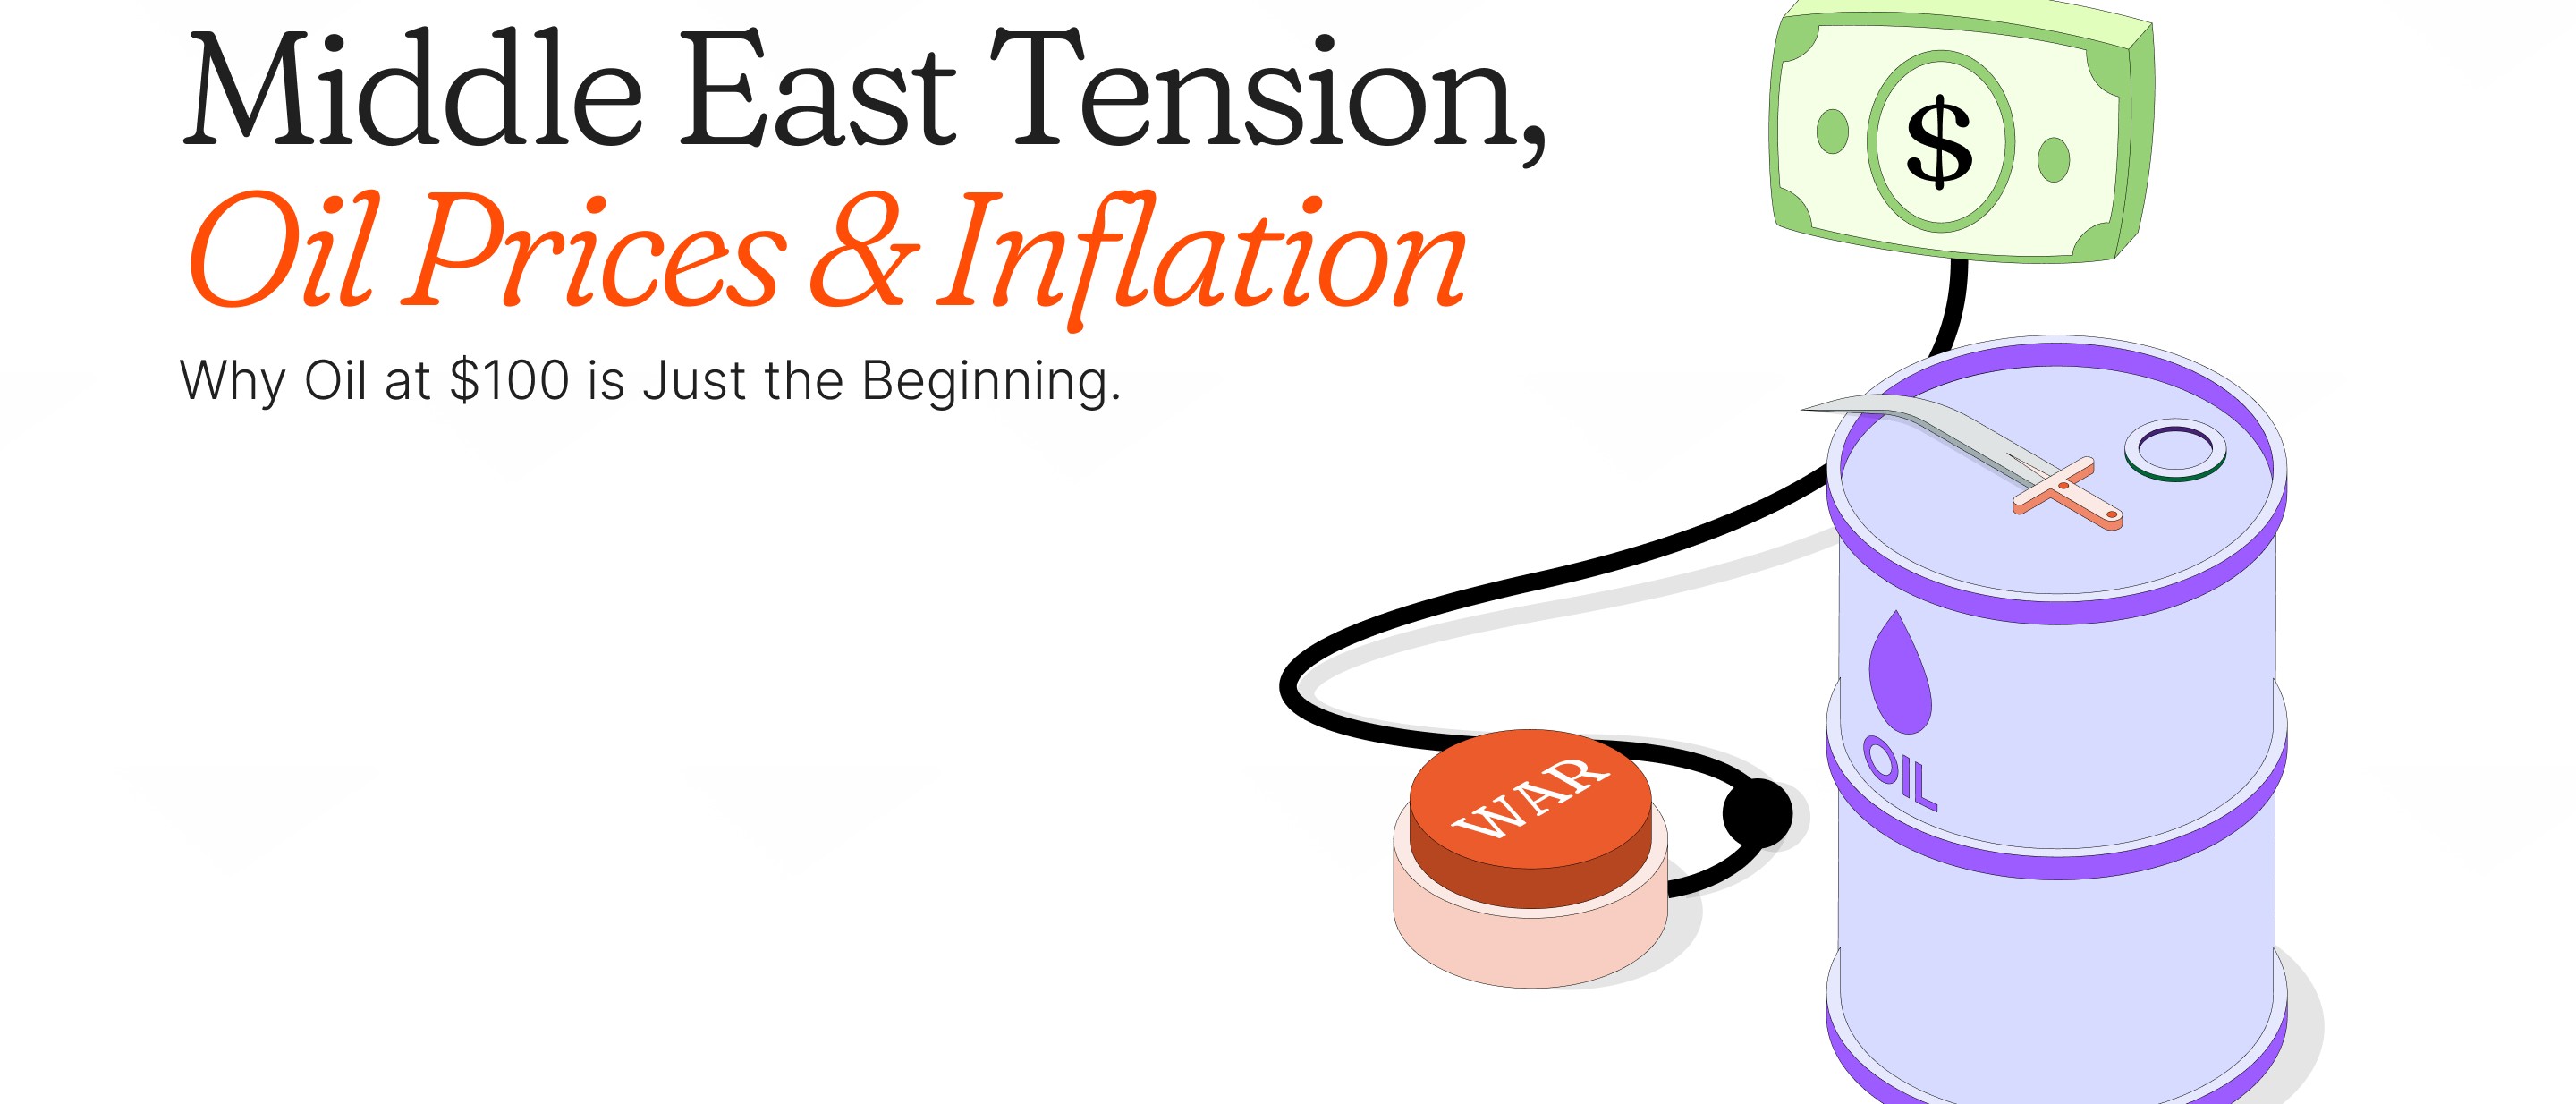
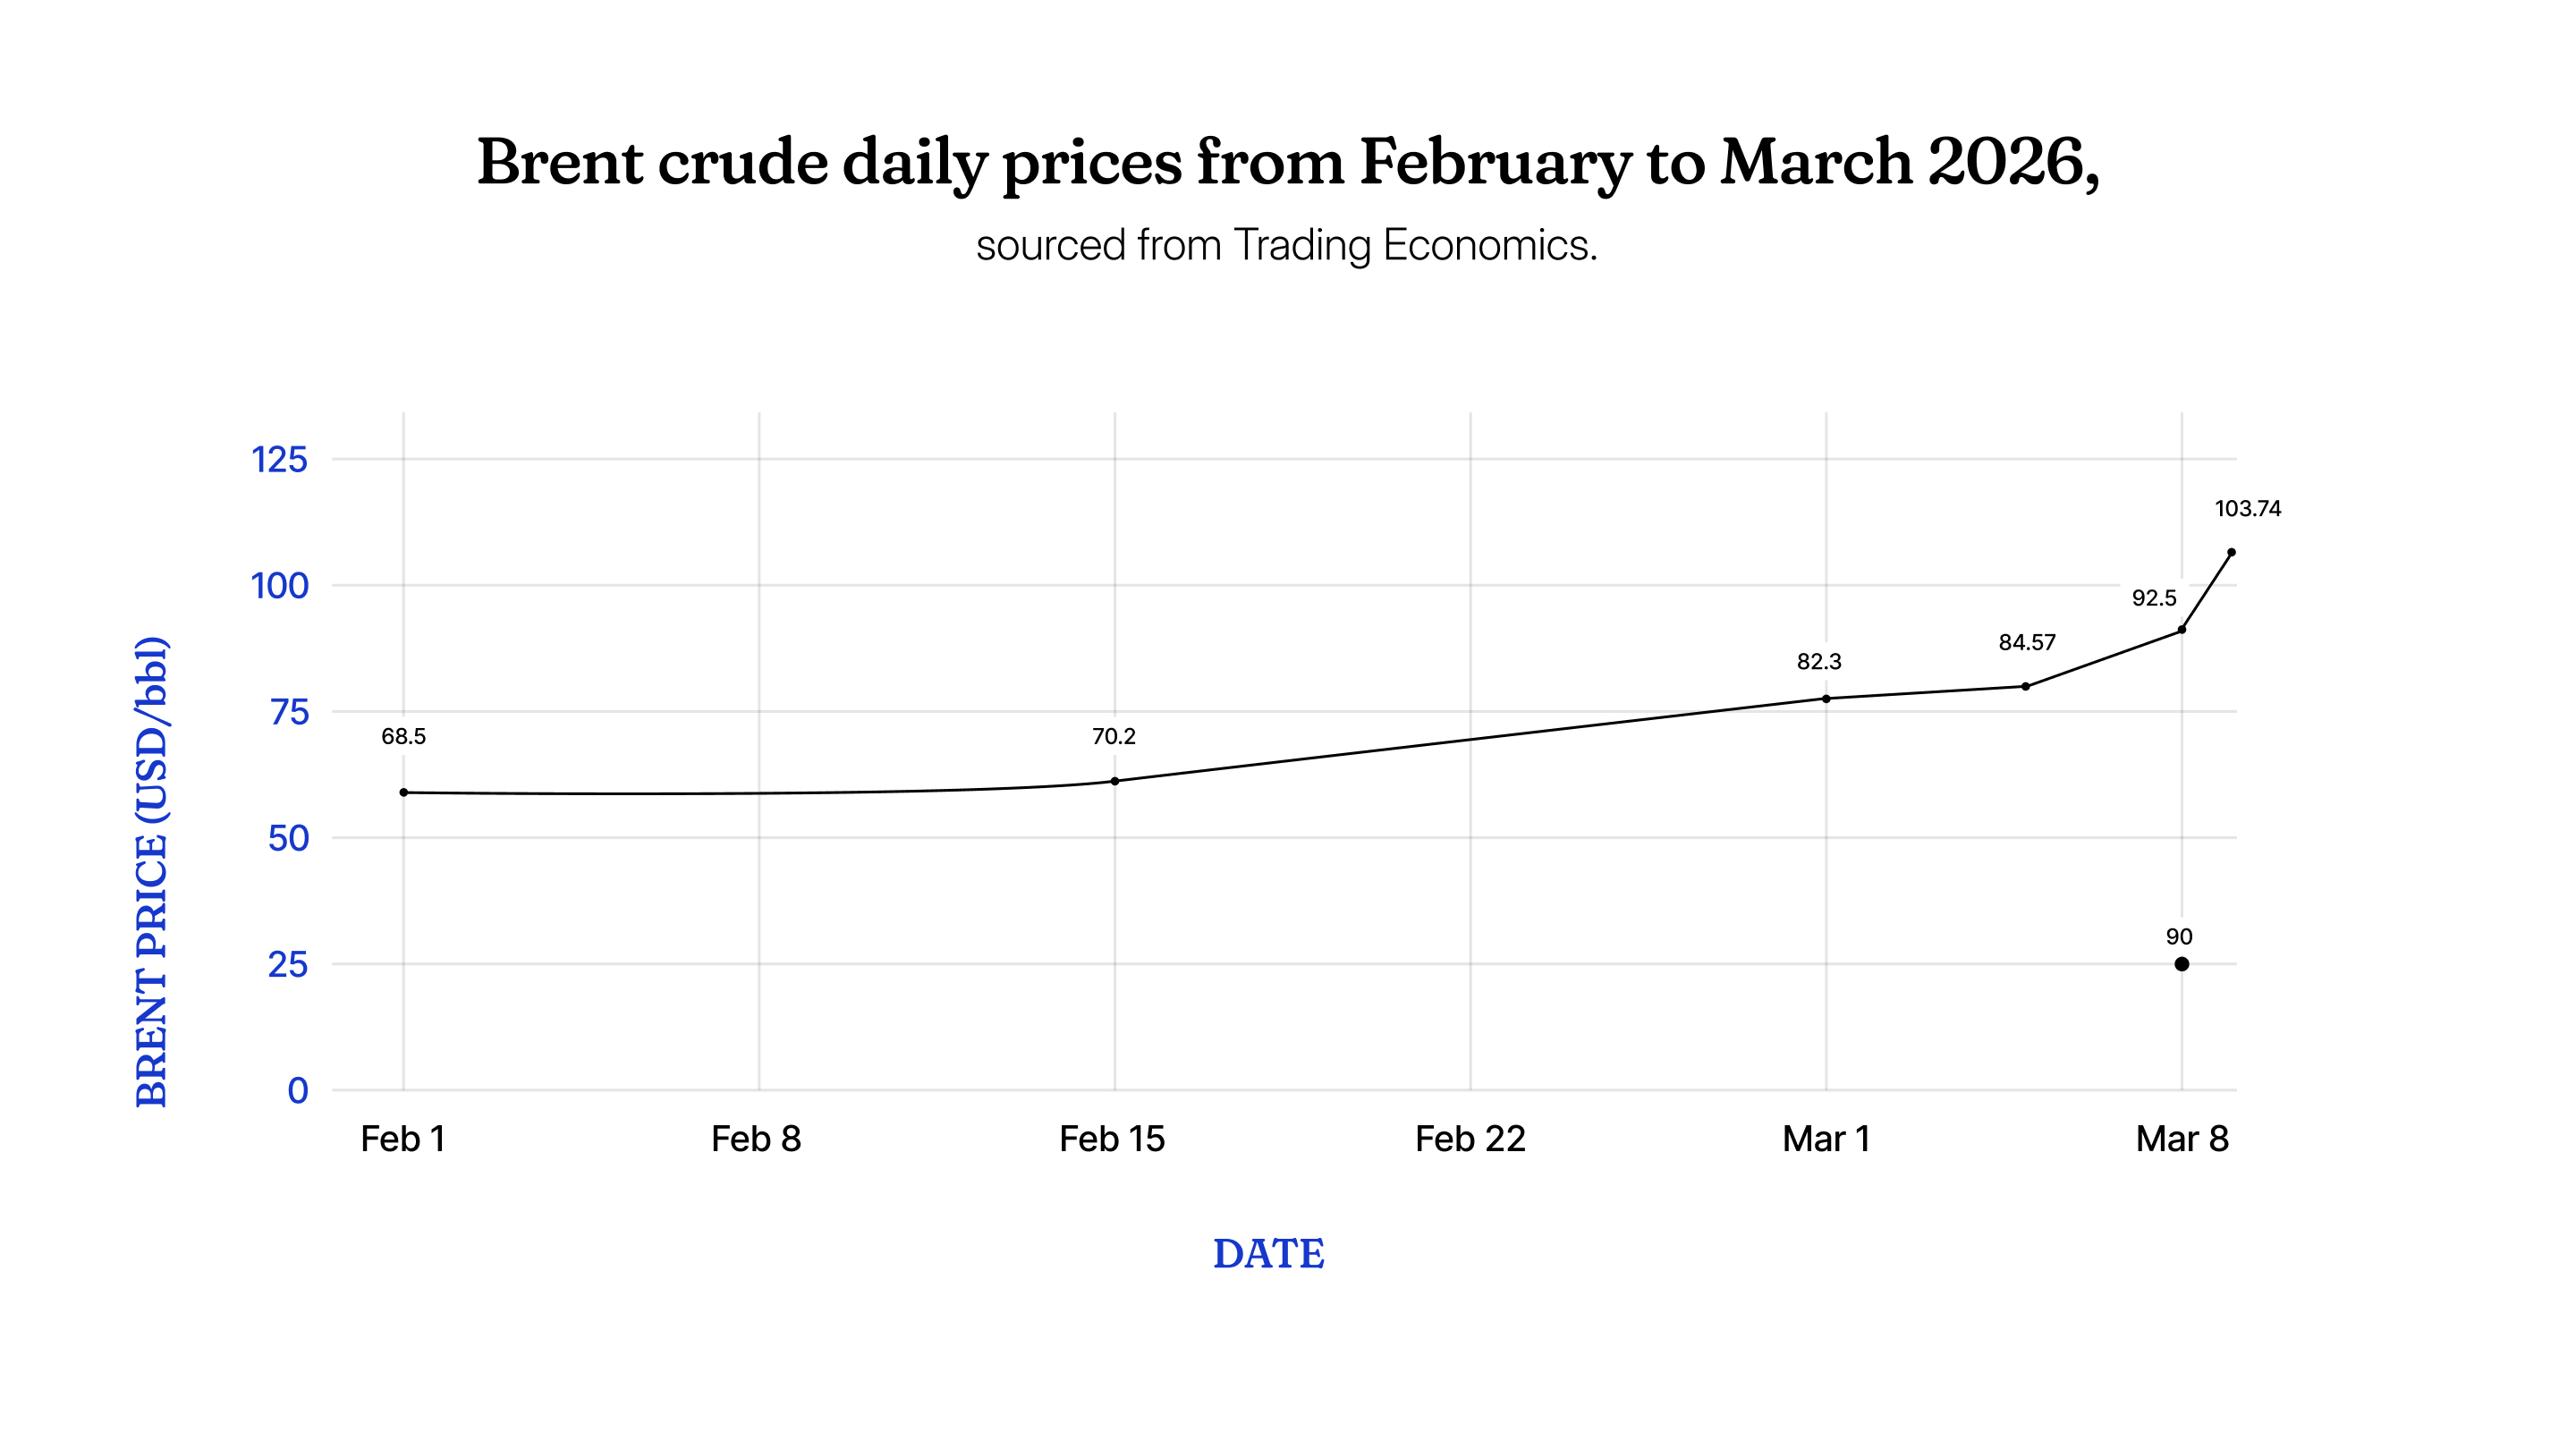
March 11, 2026 by johneb492254456 This Week’s StayWired presentation analyzes whether escalating Middle East tensions could propel oil prices to $100 per barrel and spark a fresh inflation surge amid current market volatility. Recent conflicts involving Iran have disrupted key supply routes, pushing Brent crude to highs near $104 before a slight pullback to around $92 as of early March 2026. These dynamics pose a threat to global energy security and economic stability, particularly for import-dependent nations. Brent crude spiked to $103.74 per barrel on March 9, 2026, marking an 11.93% daily gain driven by Iranian actions blocking the Strait of Hormuz, which handles over 20% of global oil flows. Conflicts have suspended nearly a fifth of regional crude and gas supplies, with producers such as Saudi Arabia, the UAE, Iraq, and Kuwait halting shipments equivalent to 140 million barrels, or approximately 1.4 days of global consumption. Drone attacks and tanker damage have stranded 150 vessels, tightening markets despite partial recoveries. A sustained 10% oil price rise persisting for a year could lift global inflation by 40 basis points while trimming growth by 0.1-0.2%, according to IMF Managing Director Kristalina Georgieva. Higher energy costs cascade into transportation, manufacturing inputs, and consumer prices, reversing disinflation in major economies like the US, Eurozone, and import-reliant Asia. Central banks may delay rate cuts, straining fiscal buffers already depleted from prior shocks. Oil-importing African nations like Kenya, Ethiopia, Ghana, Morocco, and Senegal confront severe challenges from the oil surge, as petroleum imports dominate their trade bills—exceeding 25% in Kenya alone—and drive up transport, electricity, food, and overall inflation. Nigeria, despite being an oil exporter with production stuck at 1.4-1.6 million barrels per day due to theft, vandalism, and underinvestment, experiences a double-edged sword: higher export revenues boost reserves and budgets, but import reliance for refined fuel, shipping disruptions, and FX volatility threaten petrol price hikes and domestic inflation projected at 37% in 2026 by the IMF. PETROAN warns that Middle East conflicts could disrupt supply chains, pushing retail fuel costs higher amid weakened currencies, while South Africa recalls past surges, adding 2.1 points to inflation post-Ukraine invasion. Past oil crises, such as the 2022 shock triggered by the Russia-Ukraine conflict that sent Brent crude prices soaring to over $120 per barrel and contributed to U.S. inflation peaking at 9.1% amid global supply disruptions, demonstrate that only large and persistent price spikes, often from supply shocks, lead to enduring inflation cycles, as evidenced by surges in U.S. personal consumption expenditures during prolonged disruptions. Research from the Federal Reserve Bank of Dallas highlights that energy price shocks explained up to 78% of headline inflation variability in the U.S. during volatile periods, compared to just 20% in more stable economies like Japan, underscoring the need for swift policy responses to mitigate widespread effects. Triangulating this with the current realities of the 2026 U.S.-Iran war, where oil prices have similarly surged to highs above $110 per barrel due to Strait of Hormuz blockages and regional infrastructure attacks, reveals parallels in immediate supply shocks driving inflation risks, with potential for U.S. CPI to rise from 2.4% to 3% or higher if disruptions persist Looking ahead, oil prices could test $120 per barrel or higher if Middle East tensions persist, as Barclays forecasts, potentially delaying global rate cuts and amplifying inflation in major economies, though a swift resolution hinted at by Trump might see prices retreat to around $90. The IMF warns that extended disruptions threaten broader market volatility and growth tests, with energy exporters like Canada gaining while importers suffer, but diversified renewables could buffer long-term risks. In optimistic scenarios, G7 interventions and diplomatic progress might limit the inflation wave, but analysts from Goldman Sachs and Wood Mackenzie suggest prices could reach $150 if supply losses exceed 20% of global output.
johneb492254456
An Analysis of Commodity Cycles as the Hidden Driver of Emerging-Market Currency Stability
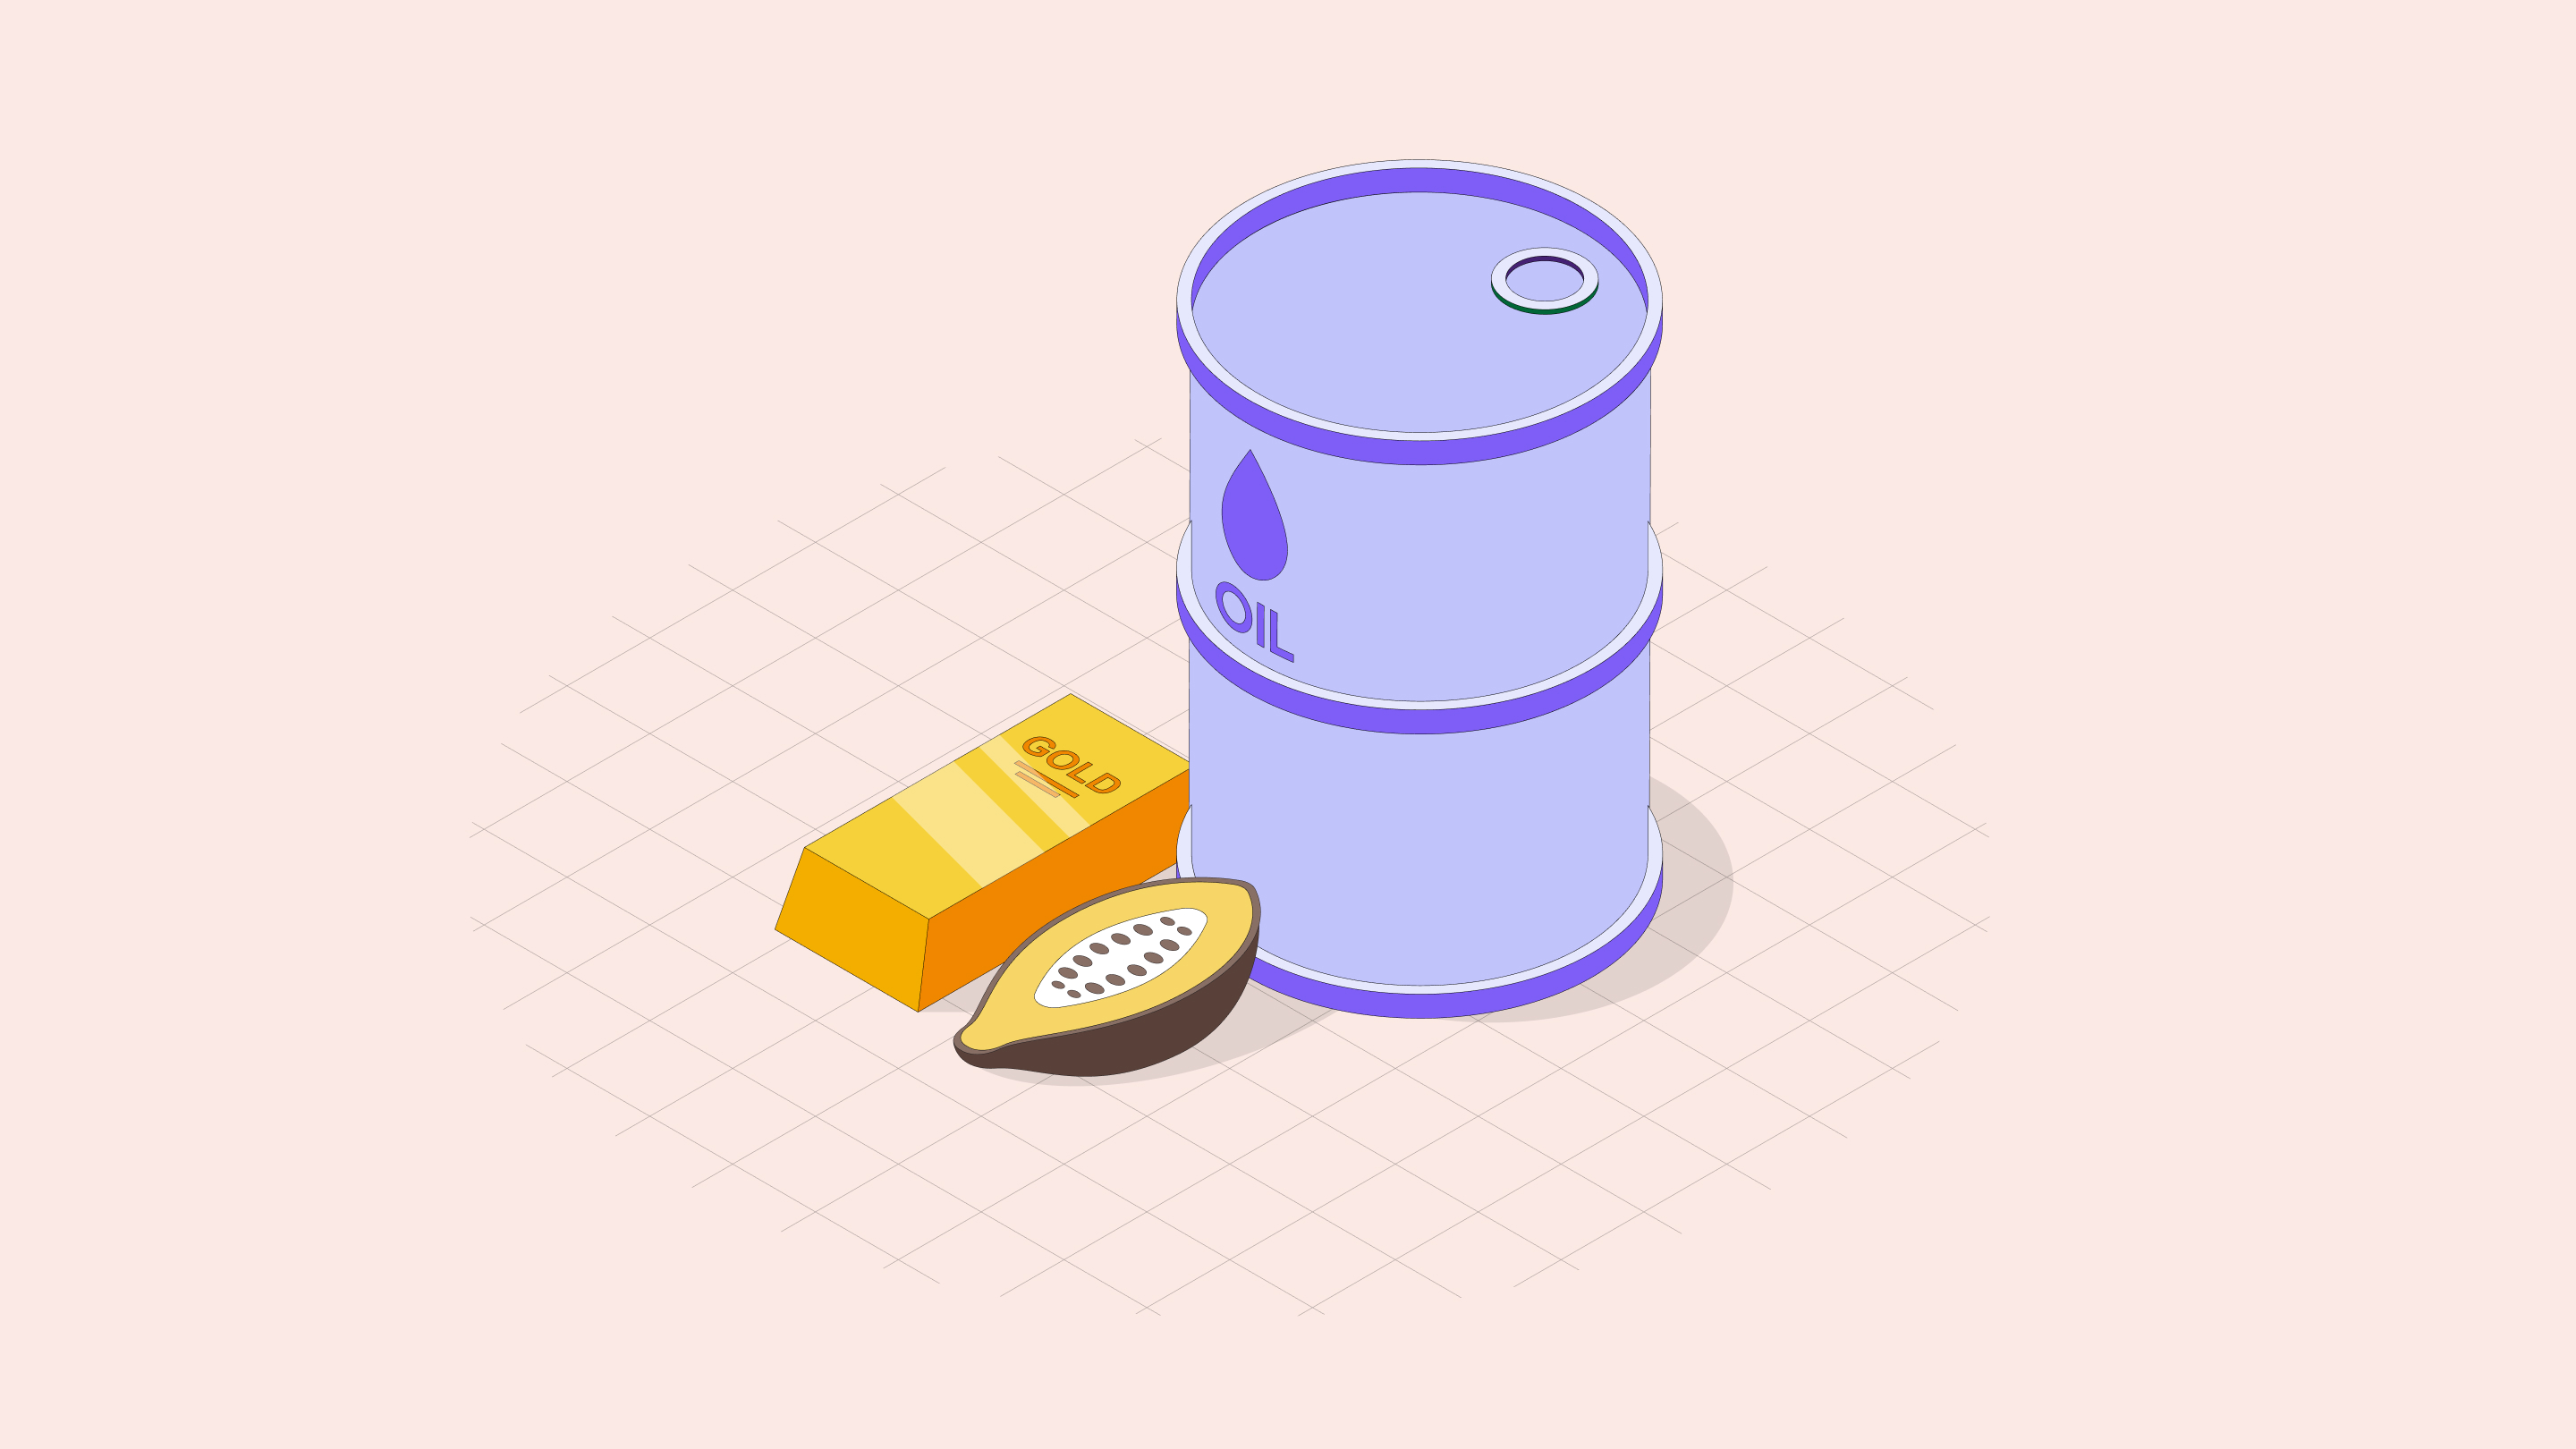
March 2, 2026 by johneb492254456 In 2024–2026, volatile commodity prices, especially cocoa, oil, and gold, have been hidden stabilizers for many emerging-market currencies. For example, soaring cocoa prices (up 172% in 2024) dramatically boosted export revenues in Ghana and the Ivory Coast, helping Ghana’s central bank build reserves and the cedi to appreciate (the cedi was about +42% stronger by mid-2025). Similarly, higher oil prices have bolstered Nigeria’s foreign exchange reserves and helped stabilize the naira (which traded below ₦1,400/$ in early 2026 as Brent rose above $69). Gold’s surge (40% higher in 2025 vs 2024) drove record trade surpluses in Peru and lifted South Africa’s terms of trade, underpinning relative stability or gains in the sol and rand. In short, commodity price cycles and emerging-market currency stability are closely linked: when export commodity prices rise, these economies often see healthier external accounts, easing exchange-rate pressure and inflation, a dynamic that influences investor confidence and central bank policy decisions. Global cocoa prices exploded in 2024 due to weather shocks in West Africa (Ghana, Ivory Coast). Cocoa jumped 172% in 2024, briefly hitting a record $13,000/ton. Analysts warned prices would stay “historically elevated” into 2025. Indeed, by October 2025, cocoa costs were still more than double early-2024 levels. (By early 2026, with better harvests on the horizon, cocoa futures began to correct – ICE cocoa prices hit multi-year lows asthe Ivory Coast/Ghana trimmed official prices.) Ghana’s cedi: Ghana, a top cocoa exporter, saw a direct benefit. The huge jump in cocoa earnings helped Ghana rebuild its foreign reserves and support the cedi. By late 2025, Ghanaian authorities credited “higher export earnings” from cocoa (and gold) for stronger external liquidity. In fact, Ghana’s cedi appreciated sharply in 2025: it was about 42% stronger against the dollar by mid-2025. This helped Ghana climb back to a B- rating (S&P noted cocoa/gold prices have “unusually favorable” in 2025, supporting the cedi and lifting reserves from $6.8B to $11B). With more FX inflows, the Bank of Ghana could ease some exchange-rate pressure – though inflation remained high (25% in early 2024), a legacy of past devaluations. Ivory Coast (CFA franc): Ivory Coast (world’s No.1 cocoa producer) saw its export revenues surge. Improved terms-of-trade from soaring cocoa exports helped narrow a large current-account deficit (projected to fall to 1–5% of GDP in 2024/25). The CFA franc (pegged to the euro) remained stable on the peg – inflation stayed around 3% – but higher cocoa FX earnings strengthened the regional reserves pool. (By late 2024, regional WAEMU reserves fell to low levels, but were buoyed by new Eurobond inflows and rules tightening repatriation of cocoa revenues.) In summary, rising cocoa prices in 2024–25 lifted Ghana’s and the Ivory Coast’s export receipts, which in turn underpinned their currencies. Ghana’s experience shows how a “commodity boom” can rapidly improve reserves and stabilize a currency. Oil price trends 2024–2026: After peaking around $80–$90 in mid-2022, crude prices cooled by late 2024. Brent ended 2024 at $74.6/barrel, down 3% on the year. In 2025, oil mostly traded in the $60–75 range (fluctuating with OPEC+ cuts and demand concerns). By early 2026, prices were rallying again: Brent was around $69 in Feb 2026, notably above Nigeria’s budget benchmark ($64.8). (Global factors like U.S.-China relations, Iran tensions, and shifts in supply/demand drove these swings.) Nigeria’s naira: Oil revenues are Nigeria’s FX lifeblood (80% of FX). As oil prices strengthened in late 2025/early 2026 (and after Nigeria eased FX market reforms), the naira steadied and even rallied slightly. In Feb 2026, analysts noted that the oil price rally “would largely bolster” Nigeria’s fiscal revenues, FX reserves, and promote exchange-rate stability. Indeed, the naira traded below ₦1,400/USD on the official market (a notable improvement). In 2025, the naira had its best year in over a decade: it gained roughly 7–7.5% in 2025 after having lost 41% in 2024. Commodity impact: Higher petrodollar inflows mean more USD supply, easing black-market pressure on the naira. (Of course, inflation and policy matters too – Nigeria’s inflation was 15% by end-2025 – but the oil tailwinds gave breathing room.) Analysts caution that lower oil (with current low production) could quickly pressure the naira again, highlighting the tight FX link. Venezuela’s bolívar: Venezuela’s case is more complex. The economy still suffers hyperinflation and extensive dollarization, but oil wealth remains central. In late 2025, the interim government agreed to ship 50 million barrels of oil to the U.S., bringing in $500m; $300m of these proceeds were injected to “stabilize” the FX market and protect the bolívar. Business leaders publicly welcomed this oil-funded USD injection as a way to “regularize and stabilize the exchange system”. In practice, these moves aimed to close the gap between Venezuela’s official and black-market rates. Still, inflation was extreme: private estimates for 2025 inflation were >400%. So while higher oil export revenues provide critical hard-currency support, the bolívar’s stability remains fragile. The currency did see a dramatic change from mid-2025: the old bolívar was replaced by a new currency (pegged loosely to the “petro” crypto), with USD/VES trading around 400 by early 2026. That’s far from stable by developed-world standards, but better than its prior hyper-inflationary collapse (USD/VES peaked at 11.8 million in July 2025). In summary, oil cycles in 2024–2026 have significantly influenced Nigeria’s and Venezuela’s currencies: higher oil prices and flows generally eased FX shortages (strengthening the naira) or allowed government FX support operations (in Venezuela), whereas low oil periods would reverse those effects. Gold price trends 2024–2026: Gold has been a standout commodity in 2024–25. After a mid-2022 correction, gold prices surged in 2024–2025 amid inflation and geopolitical uncertainty. Scotiabank notes gold averaged 40% higher in 2025 than in 2024 (though some cooling is expected in 2026). Precious metals benefited from safe-haven demand: the USD’s unusual weakness in late 2024/25 also helped gold (and other metals) prices. Thus, 2024–25 saw multi-year highs in many currencies: for example, in Nigeria, the naira price of gold tripled (up 121%) due to devaluations and inflation, and Venezuela saw an 84% rise in gold in bolívars. These are extreme cases of how inflation erodes currencies – investors flocked to gold. South Africa (rand): South Africa is one of the world’s largest gold producers. Rising global gold prices help its export revenues and terms of trade. Indeed, in late 2025, the rand was noted to be strengthening alongside gold: Reuters reported on Dec 15, 2025, that the rand “strengthened” against the dollar as “higher gold prices” supported it. Local traders explicitly link Rand gains to the gold rally, and forecasts noted South African gold prices rose 30–45% in local-currency terms. While the rand also depends on many factors (like trade flows and Fed policy), the gold boom provided a tailwind. The South African Reserve Bank also cited resilient FDI inflows and stable inflation. Still, the direct link to gold is clear: when bullion is firm, miners export more revenue, giving the rand support. Peru (sol): Peru is a major producer of gold (and copper). Soaring metals prices vastly improved Peru’s terms of trade in 2024–25. Scotiabank reports Peru ended 2025 with a record trade surplus, driven by metal exports – gold alone was on average 40% pricier than in 2024. These export gains translated into a strong sol (PEN). Remarkably, the sol “showed a surprising combination of strength and stability in 2025”: it appreciated about 5–7% on the year (around S/3.56 per USD by year-end 2025). While the primary reason cited is a very weak US dollar globally, Peru’s robust external accounts were a close second driver. In short, high gold and copper earnings gave policymakers room to cut rates and keep inflation low (consumer inflation held near 2% by the end of 2025), which in turn supported the currency. (Note: Peru’s central bank often tightens in election years, but solid trade gave it flexibility.) These commodity-currency links interact with broader macroeconomics. Key points: Commodity price booms have quietly underpinned currency stability in key emerging markets from 2024 through early 2026. Soaring cocoa prices in West Africa bolstered the cedi and eased balance-of-payments strains in Ghana and Ivory Coast. Rising oil prices and improved fiscal oil receipts buoyed Nigeria’s naira and gave breathing space to its economy. And gold’s bull run helped South Africa and Peru accumulate reserves and keep inflation in check, supporting their currencies. These hidden commodity cycles — intertwined with macro factors like inflation and policy — have shaped investor sentiment and central bank choices in the region. Future fluctuations in cocoa, oil, and gold will likely continue to ripple through emerging-market FX markets, making them essential bellwethers for analysts and policymakers alike.
johneb492254456
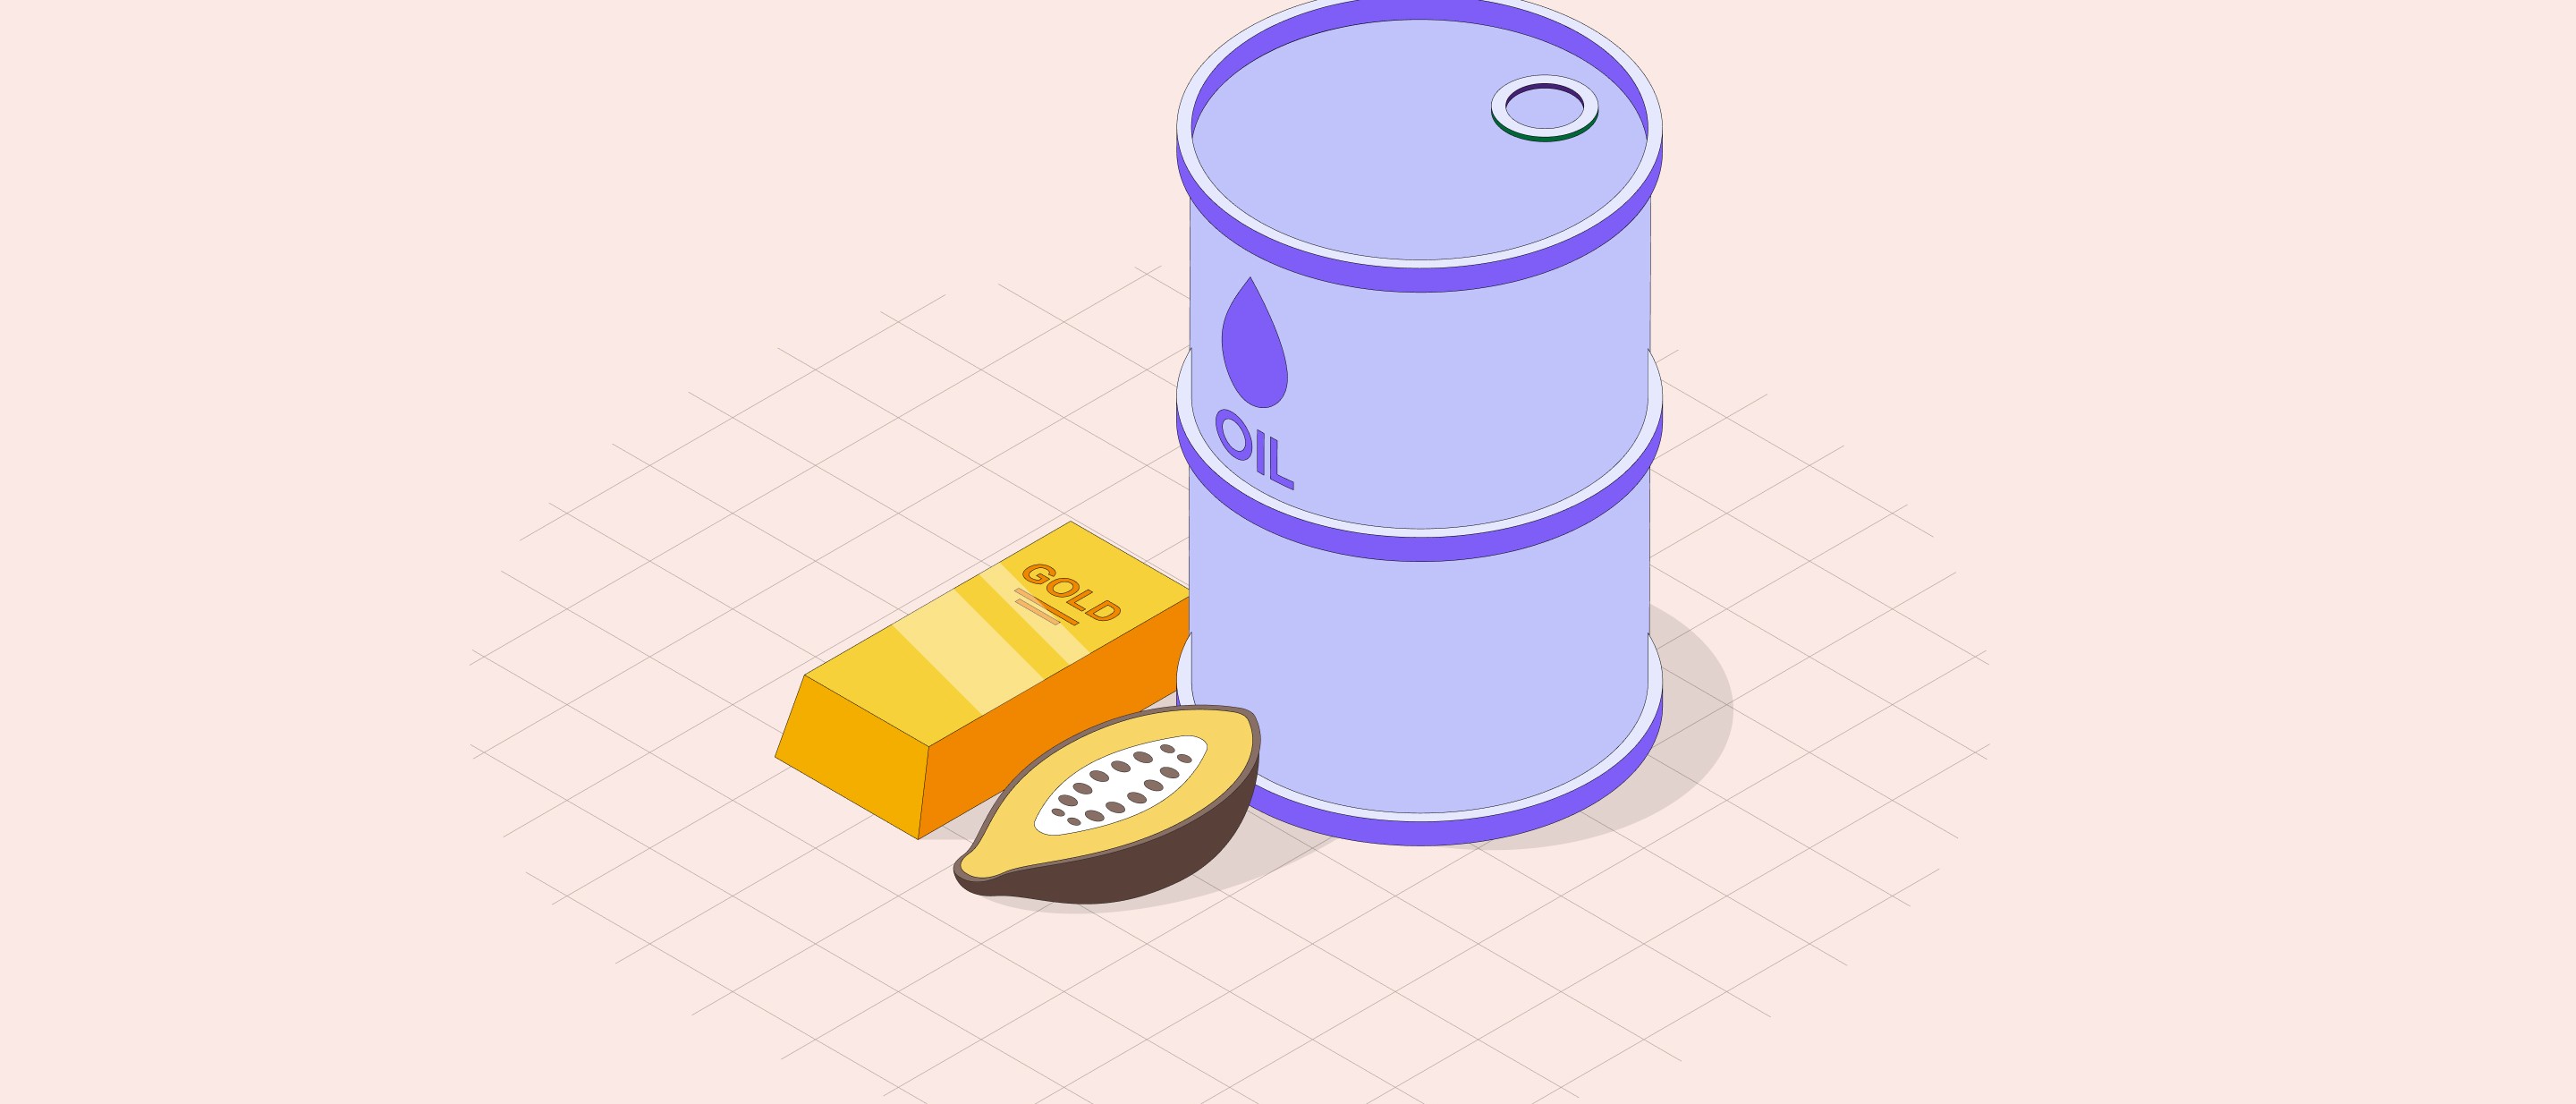
Cocoa Cycles & West African Currencies (Ghana, Ivory Coast)
Oil Cycles & Petrocurrencies (Nigeria, Venezuela)
Gold Cycles & Mining Economies (South Africa, Peru)
Macro Factors, Inflation, and Policy Implications
Conclusion

Nigeria’s Rate Pivot: Assessing the Impact of the CBN’s 26.5% Policy Rate on the Naira Outlook
February 27, 2026 by johneb492254456 Nigeria’s Central Bank, CBN, executed a pivotal monetary policy shift on February 23-24, 2026, trimming the Monetary Policy Rate (MPR) by 50 basis points to 26.5% from 27%, marking the first cut of the year and the second under Governor Olayemi Cardoso’s tenure. This decision, made at the 304th Monetary Policy Committee (MPC) meeting, reflects growing confidence in Nigeria’s disinflation trajectory, with headline inflation easing to 15.1% in January 2026 from peaks above 34% in prior years. While retaining the Cash Reserve Ratio (CRR) at 45% and the Liquidity Ratio at 30%, the CBN signaled a cautious pivot toward supporting growth amid stabilizing external buffers like foreign reserves hitting a 13-year high near $50 billion. This rate adjustment arrives against a backdrop of robust naira performance in February 2026, as highlighted in Wiretimes’ Weekly FX and Market Intelligence report by Wewire. The report notes that the currency outperformed the African FX basket, appreciating steadily across three reporting weeks: it kicked off with a 1.44% week-to-date (WTD) gain to USD/NGN 1,363.34 (month-to-date or MTD: 1.44%; year-to-date or YTD: 5.59%), built on that momentum with a further 0.90% WTD advance to 1,351.05 (MTD: 2.32%; YTD: 6.44%), and moderated to a 0.67% WTD rise ending at 1,342.06 by February 19 (MTD: 2.97%; YTD: 7.06%). This sustained strength was fueled by bolstered FX liquidity, sharper price discovery through ongoing market reforms, and dampened dollar demand, all reinforcing near-term stability for the naira. The Naira’s February rally played out distinctly across markets, underscoring maturing FX reforms initiated in mid-2023. In the Nigerian Autonomous Foreign Exchange Market (NAFEM) the official window, the naira appreciated progressively. It opened February around ₦1,386.55/$1, dipped briefly to ₦1,390/$1 early on, then strengthened to ₦1,345.45/$1 by February 18 and ₦1,342.06/$1 by February 19. CBN data confirms a simple average (mean) rate of ₦1,356.98/$1 on February 25, with intraday highs at ₦1,361.50 and lows at ₦1,353.00, closing at ₦1,359.50. Investing.com tracked USD/NGN at approximately ₦1,351.82 on February 25, up 0.06% daily but reflecting 4.51% monthly gains. Parallel rates, often called the “black market,” traded at a premium but converged notably. Early February saw USD/NGN between ₦1,440-₦1,465/$1, narrowing the arbitrage gap. By mid-month (February 9-18), it stabilized at ₦1,440-₦1,455 buy and up to ₦1,480-₦1,510 sell amid school fees and import demand. This premium around 8-12% over NAFEM has shrunk from 2025 highs, signaling reduced speculation. Lower policy rates typically exert downward pressure on currencies by reducing foreign capital inflows seeking high yields. In Nigeria, however, the 50bps trim to 26.5%, still elevated globally, may reinforce naira strength through transmission channels. Lower domestic credit costs (e.g., lower lending rates) curb import demand, easing dollar pressure and supporting FX reserves. Enhanced liquidity from retained CRR aids banks in funding real sector loans, stabilizing inflows without overheating inflation. Analysts like FXTM’s Lukman Otunuga note the cut “stabilizes and potentially bolsters” the naira, given its 6% YTD gains pre-cut. Bullish Outlook for Naira Stability CBN eyes 4.49% GDP growth and 12.94% inflation for 2026, implying steady naira around current levels. Key Risks and Downside Scenarios Carry Trade Reversal: If global rates (e.g., Fed at 4-5%) stay attractive, outflows could test ₦1,400/$1 in NAFEM. For portfolios, the pivot favors naira assets: overweight local equities (banks up 5-10% post-announcement), sovereign bonds (yields dipping 50-100bps), and hedged dollar exposure. Exporters benefit from stability, while importers lock rates amid convergence. Monitor MPC March signals further cuts hinge on February CPI (due early March). In sum, the 26.5% MPR anchors a “soft landing,” extending February’s naira momentum into 2026 stability, provided reforms endure. Investors should eye reserves and oil for directional cues.
johneb492254456

Naira’s February Surge: Official and Parallel Market Dynamics
NAFEM (Official) Rates
Parallel (Black) Market Rates
Market
Early Feb Rate (USD/NGN)
Mid-Feb Rate (USD/NGN)
Feb 25 Rate (USD/NGN)
Appreciation (MTD Feb)
NAFEM (Official)
1,386-1,390
1,342-1,345
1,356.98 (avg)
2.97%[user-provided data]
Parallel/Black
1,440-1,465
1,440-1,510
N/A (est. 1,480-1,500)
2-3% (aligned)
Mechanics of Rate Cuts and Currency Valuation
Potential Impacts: Bullish Case vs. Risks
Scenario
Naira Projection (USD/NGN, End-2026)
Key Driver
Probability
Base (Continued Reforms)
1,320-1,380
Reserves >$51B, cuts to 24%
60%
Bull (Aggressive Easing)
<1,300
FX inflows double
20%
Bear (Global Shock)
>1,450
Oil <$70, outflows
20%
Strategic Implications of Nigeria’s Rate Pivot for Investors